POPULAR
 Data Interpretation Question and Answer
  2093 views
In the various competitive examinations including SSC, Police, Bank, under the subject of Mathematics, Data Interpretation questions play a very important role for the selection in the Government Examination. As is evident from data interpolation itself, you have to assess from the given data. Along with this data, you are given some questions, you have to search for answers with the help of available data. You can be given data in any form including graphics, tables, graphs, charts. If you are also preparing for the above competitive exams, then here you can get the questions based on Data Interpretation with the help of the provided blog.

Data Interpretation is an essential part of the Mathematics subject of Quantitative Aptitude. Basically, data interpretation is based on the bar graph, line graph, tabulation,s and pie chart questions. Here are sharing some important questions related to this article.
The following histogram shows the height of players of a basketball team of a school.
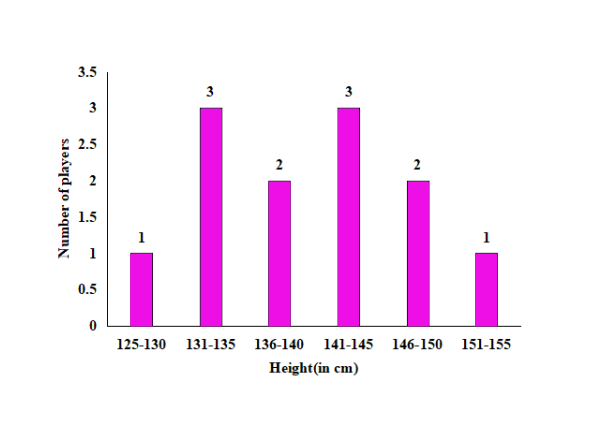
How many players have height less than 141 cm?
1.4K 0 6450d85b39143d085f373d2eThe bar graph shows the number of passports issued in a country in 6 consecutive years.
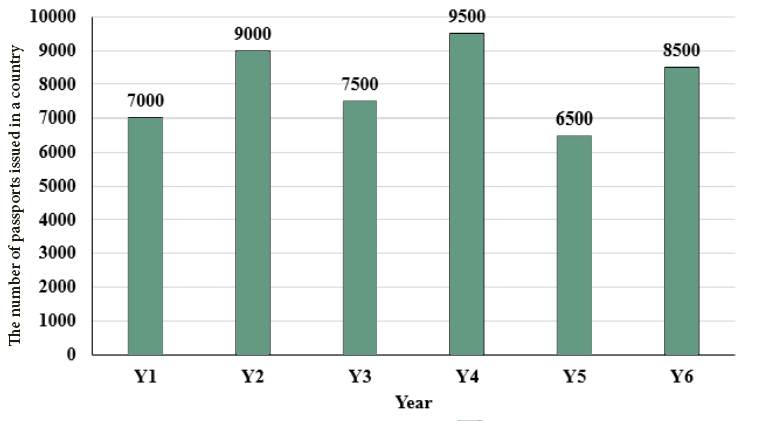
What is the average number of passports issued per year?
1.3K 0 6450cd6139143d085f370f7dThe table given below shows the cost price and selling price of four articles.
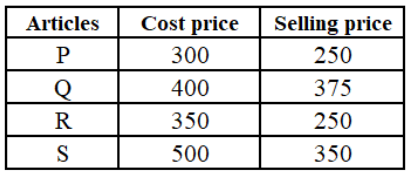
What is the average value of loss of all articles?
1.4K 0 6450b2a7f3618908bf57165d