Data Interpretation Question and Answer


Data Interpretation is an essential part of the Mathematics subject of Quantitative Aptitude. Basically, data interpretation is based on the bar graph, line graph, tabulation,s and pie chart questions. Here I am sharing some important questions related to this topic.
With the help of these questions, you can easily understand the topic of Data Interpretation and improve your performance.
Selective Data Interpretation Questions
Study the given graph and answer the question that follows. If 60% of the total number of students obtaining 50 marks or more but less than 70 marks are girls and 55 % of the total number of students obtaining 70 marks or more but less than 90 marks are also girls. Then the total number of girls obtaining 50 marks or more but less than 90 marks is: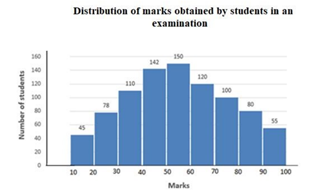
(A) 261
(B) 207
(C) 236
(D) 257
Correct Answer : A
Study the given graph and answer the question that follows.
The total number of students obtaining less than 50 marks is what percentage more than the total number of students obtaining 60 marks or more ( correct to one decimal place).
(A) 6.8
(B) 6.2
(C) 4.4
(D) 5.6
Correct Answer : D
Study the given pie chart and answer the question that follows.
Distribution (Degree wise) of students studying in schools A, B, C, D and E
Total Number of students =9000
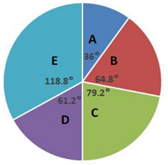
If the ratio of the number of boys to that of girls in school C is 6 : 5 and that in school B is 7 : 11,then what is the ratio of the number of boys in school C to the number of girls in school B?
(A) 10 : 11
(B) 11 : 10
(C) 12 : 11
(D) 11: 12
Correct Answer : C
Study the given pie chart and answer the question that follows.
Distribution (Degree wise) of students studying in schools A, B, C, D and E
Total Number of students =9000
The number of students in School E exceeds the total number of students in school A and B by x, where x lies between:
(A) 440 and 460
(B) 420 and 440
(C) 460 and 480
(D) 400 and 420
Correct Answer : A
Study the given pie chart and answer the question that follows.
Distribution (Degree wise) of students studying in schools A, B, C, D and E
Total Number of students =9000
The total number of students in schools D and E is what percentage more than the total number of students in school B and C?
(A) 25
(B) 20
(C) 30
(D) 35
Correct Answer : A
Directions: The following table represents the percentage marks of four students in six subjects.
Consider the table and answer questions based on it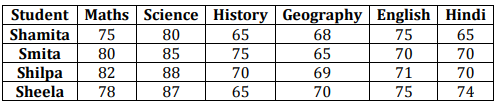
The average marks obtained by the students in Geography and History are
(A) 68.75 and 68
(B) 70.5 and 69
(C) 68 and 68.75
(D) 68.75 and 68.5
Correct Answer : C
Directions: The following table represents the percentage marks of four students in six subjects.
Consider the table and answer questions based on it
Average marks obtained in Science is higher than that of Maths by
(A) 1.5
(B) 20
(C) 6.25
(D) 40
Correct Answer : C
Directions: The following table represents the percentage marks of four students in six subjects.
Consider the table and answer questions based on it
Who has the highest total marks?
(A) Shamita
(B) Smita
(C) Shilpa
(D) Sheela
Correct Answer : C
The given table represents the number of engineers recruited by four companies A, B, C and D over the years. Study the table carefully and answer the question that follow.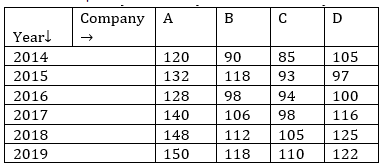
The total number of engineers recruited by company A in 2014 to 2017 is what percentage more than the total number of engineers recruited by all four companies in 2019?
(A) 3.5
(B) 2.5
(C) 3
(D) 4
Correct Answer : D
Study the given graph and answer the question that follows.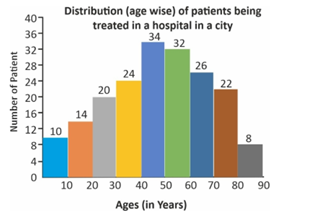
The number of patients aged 10 or more years but below 40 years is what per cent less than the number of patients aged 50 or more years but below 80 years?
(A) 30.2
(B) 25
(C) 34
(D) 27.5
Correct Answer : D
Showing page 1 of 6
enhttps://www.examsbook.com/data-interpretation-question-and-answer61data-interpretation-question-and-answerAbout author

Vikram Singh
Providing knowledgable questions of Reasoning and Aptitude for the competitive exams.
Read more articles