Join Examsbook
The bar graph given below shows the production of sugar (in lakh tonnes) by two different companies P and Q for the given years.
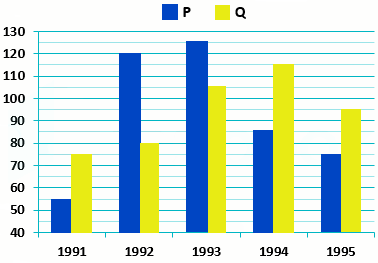
J1 = percentage increase in production of sugar of company P from 1991 to 1995.
J2 = percentage increase in production of sugar of company Q from 1992 to 1994.
What is the value of J1 + J2?
5Q:
The bar graph given below shows the production of sugar (in lakh tonnes) by two different companies P and Q for the given years.
J1 = percentage increase in production of sugar of company P from 1991 to 1995.
J2 = percentage increase in production of sugar of company Q from 1992 to 1994.
What is the value of J1 + J2?
- 148 percentfalse
- 280.11 percenttrue
- 386.22 percentfalse
- 476.11 percentfalse
- Show AnswerHide Answer
- Workspace