Maths Practice Question and Answer
8 Q: Average of the test scores of a class of 'x' students is 80 and that of 'y' student is 94. When the scores of both the classes are combined, the average becomes 86. What is the ratio of x to y?
1051 063d003406363580df38ad8d0
63d003406363580df38ad8d0- 16 : 5false
- 25 : 4false
- 34 : 3true
- 47 : 6false
- Show AnswerHide Answer
- Workspace
- SingleChoice
Answer : 3. "4 : 3 "
Q: Babulal can do a work in 36 days while Rajesh can do the same in 48 days. If Babulal work for ‘x’ days while Rajesh work for ‘x+2’ days then one-third of the work is complete. Find the value of x.
955 063d001a76363580df38ad483
63d001a76363580df38ad483- 14false
- 28false
- 36true
- 47false
- Show AnswerHide Answer
- Workspace
- SingleChoice
Answer : 3. "6"
Q:Directions: Following is the pie-chart showing the spending of a family on various items in a particular year
Study the pie chart and answer questions
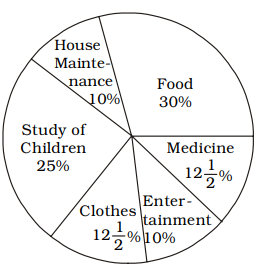
If the difference in the amount spent for buying clothes and house maintenance was ₹ 1,500, how much they spent for house maintenance?
1381 063be706261d62119f1dbc6fa
63be706261d62119f1dbc6fa- 1₹ 5,000false
- 2₹ 6,000true
- 3₹ 7,000false
- 4₹ 8,000false
- Show AnswerHide Answer
- Workspace
- SingleChoice
Answer : 2. "₹ 6,000 "
Q:Directions: Following is the pie-chart showing the spending of a family on various items in a particular year
Study the pie chart and answer questions
Angle of the pie chart representing the expenditure on entertainment is
981 063be702174eba5069d517362
63be702174eba5069d517362- 115°false
- 210°false
- 336°true
- 426°false
- Show AnswerHide Answer
- Workspace
- SingleChoice
Answer : 3. "36°"
Q:Directions: Following is the pie-chart showing the spending of a family on various items in a particular year
Study the pie chart and answer questions
If the total amount spent on the family during the year was ₹ 35,000, the amount spent for study of children and food together was
948 063be6fa261d62119f1dbc4a2
63be6fa261d62119f1dbc4a2- 119,250true
- 219,500false
- 319,750false
- 419,850false
- Show AnswerHide Answer
- Workspace
- SingleChoice
Answer : 1. "19,250 "
Q:Directions: Following is the pie-chart showing the spending of a family on various items in a particular year
Study the pie chart and answer questions
If the total amount spent on the family during the year was ₹ 50,000, how much they spent for buying clothes?
802 063be6f4861d62119f1dbc38c
63be6f4861d62119f1dbc38c- 1₹ 6,250true
- 2₹ 6,500false
- 3₹ 7,250false
- 4₹ 7,500false
- Show AnswerHide Answer
- Workspace
- SingleChoice
Answer : 1. "₹ 6,250 "
Q:Directions: Following is the pie-chart showing the spending of a family on various items in a particular year
Study the pie chart and answer questions
The ratio of the total amount spent for food and medicine is
984 063be6ef28f5b1f774c4c911f
63be6ef28f5b1f774c4c911f- 11 : 2false
- 23 : 1false
- 312 : 5true
- 411 : 5false
- Show AnswerHide Answer
- Workspace
- SingleChoice
Answer : 3. "12 : 5 "
Q:Directions: The following Pie Chart shows the export of different food grains from India in 2010. Study the chart and answer the questions:
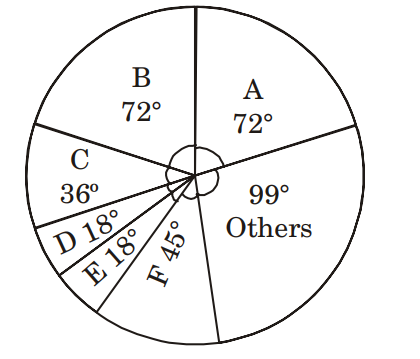
If the revenue from 1 quintal of crop A is thrice that from 1 quintal of crop C, then the ratio of the total revenues of A and C is
916 063be6b9f1b93047bc20cdf06
63be6b9f1b93047bc20cdf06- 11 : 6false
- 22 : 3false
- 33 : 2false
- 46 : 1true
- Show AnswerHide Answer
- Workspace
- SingleChoice