Maths Practice Question and Answer
8 Q: If the total monthly income of 16 persons is ₹ 80,800 and the income of one of them is 120% of the average income, then his income is
1272 063a98b87e590d4085fc68c79
63a98b87e590d4085fc68c79- 1₹ 5,050false
- 2₹ 6,060true
- 3₹ 6,160false
- 4₹ 6,600false
- Show AnswerHide Answer
- Workspace
- SingleChoice
Answer : 2. "₹ 6,060 "
Q: Radha spends 40% of her salary on food, 20% on house rent, 10% on entertainment and 10% on conveyance. If her savings at the end of a month are ₹ 1500, then her salary per month (in ₹) is
1552 163a98b43e541fa7a011908f6
63a98b43e541fa7a011908f6- 1₹ 8000false
- 2₹ 7500true
- 3₹ 6000false
- 4₹ 10000false
- Show AnswerHide Answer
- Workspace
- SingleChoice
Answer : 2. "₹ 7500 "
Q: In what time will the simple interest be $${2\over 5}$$ of the principle at 8 percent per annum ? 1819 05cfe008bbc9a366f2932575f
5cfe008bbc9a366f2932575f- 18 yearsfalse
- 27 yearsfalse
- 35 yearstrue
- 46 yearsfalse
- Show AnswerHide Answer
- Workspace
- SingleChoice
Answer : 3. "5 years"
Q: A pipe can empty a tank in 40 minutes. A second pipe with diameter twice as much as that of the first is also attached with the tank to empty it . The two pipe together can empty the tank in:
2098 05d987c0d1ece4b483a8c63bc
5d987c0d1ece4b483a8c63bc- 18 minutestrue
- 213 minutesfalse
- 330 minutesfalse
- 438 minutesfalse
- Show AnswerHide Answer
- Workspace
- SingleChoice
Answer : 1. "8 minutes"
Q:Directions : The following graph shows production (in thousands) of two types (P and Q) of vehicles by a factory over the years 2009 to 2014. Study the graph and answer the given questions.
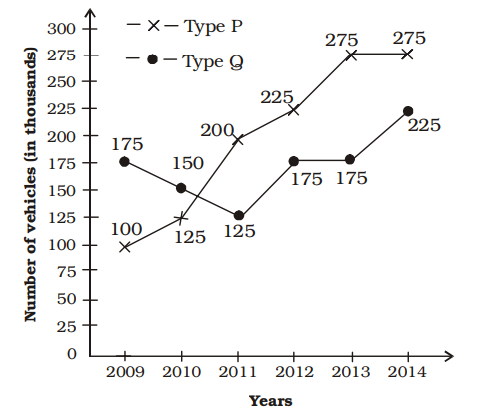
The production of Type Q vehicles in 2010 was approximately what percent of Type P vehicles in 2014?
885 063a56e408fc9692134069535
63a56e408fc9692134069535 - 160false
- 245.5false
- 354.5true
- 475false
- Show AnswerHide Answer
- Workspace
- SingleChoice
Answer : 3. "54.5 "
Q:Directions : The following graph shows production (in thousands) of two types (P and Q) of vehicles by a factory over the years 2009 to 2014. Study the graph and answer the given questions.
The ratio of total production of Type P vehicles to total production of type Q vehicles over the years is
845 063a56da8b580da5a6237fd52
63a56da8b580da5a6237fd52 - 148 : 41true
- 25 : 8false
- 35 : 8false
- 441 : 48false
- Show AnswerHide Answer
- Workspace
- SingleChoice
Answer : 1. "48 : 41 "
Q:Directions : The following graph shows production (in thousands) of two types (P and Q) of vehicles by a factory over the years 2009 to 2014. Study the graph and answer the given questions.
The total production of Type P vehicles in the years 2009 and 2011 is what percent of total production of Type Q vehicles in 2010 and 2014?
786 063a56d3024e8fb08b9fe2176
63a56d3024e8fb08b9fe2176 - 175false
- 269.25false
- 380true
- 481.25false
- Show AnswerHide Answer
- Workspace
- SingleChoice
Answer : 3. "80 "
Q:Directions : The following graph shows production (in thousands) of two types (P and Q) of vehicles by a factory over the years 2009 to 2014. Study the graph and answer the given questions.
In how many of the given years, was the production of Type P vehicles of the company more than the average production of this type vehicles in the given years?
864 063a56c9824e8fb08b9fe1f85
63a56c9824e8fb08b9fe1f85 - 13true
- 24false
- 32false
- 45false
- Show AnswerHide Answer
- Workspace
- SingleChoice