Maths Practice Question and Answer
8 Q:Direction: Study the pie chart carefully and answer the given questions. The pie chart shows the percentage breakup of students in different classes from VI to X in the year 2017
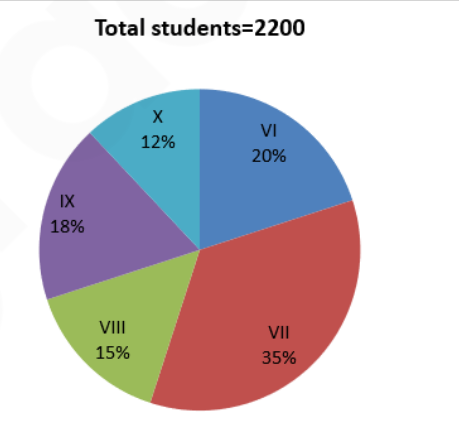
If in 2018, the total number of students in class VI and class VII is increased by 10% each and the total number of students in class VIII is decreased by 20% then what is the difference between the total number of students in class VI and VII together in 2018 to that of the total number of students in class VIII in 2018?
1247 060a257bcde4c2e1331dbeaa4
60a257bcde4c2e1331dbeaa4- 11078false
- 2878false
- 3976false
- 41067true
- 51156false
- Show AnswerHide Answer
- Workspace
- SingleChoice
Answer : 4. "1067"
Q:Direction: Study the pie chart carefully and answer the given questions. The pie chart shows the percentage breakup of students in different classes from VI to X in the year 2017
If in class VI, the ratio of boys to girls is 6:5 and the total number of girls in class VI is 50 less than that of the total number of girls in class VII. Find the ratio of the total number of boys in class VI to class VII.
1704 060a25701de4c2e1331dbe874
60a25701de4c2e1331dbe874- 16:13true
- 24:5false
- 35:7false
- 47:11false
- 59:13false
- Show AnswerHide Answer
- Workspace
- SingleChoice
Answer : 1. "6:13"
Q:Direction: Study the pie chart carefully and answer the given questions. The pie chart shows the percentage breakup of students in different classes from VI to X in the year 2017
The total number of students study in class VI and class IX together is approximate what percentage more than that of the total number of students study in class X?
2055 060a256afb1d2440614b9fabb
60a256afb1d2440614b9fabb- 1189%false
- 277%false
- 3125%false
- 4280%false
- 5217%true
- Show AnswerHide Answer
- Workspace
- SingleChoice
Answer : 5. "217%"
Q:Directions: The following bar graph shows the percentage breakup of a Sunil’s salary from year 2012 to 2016. With the given information, find the following questions.
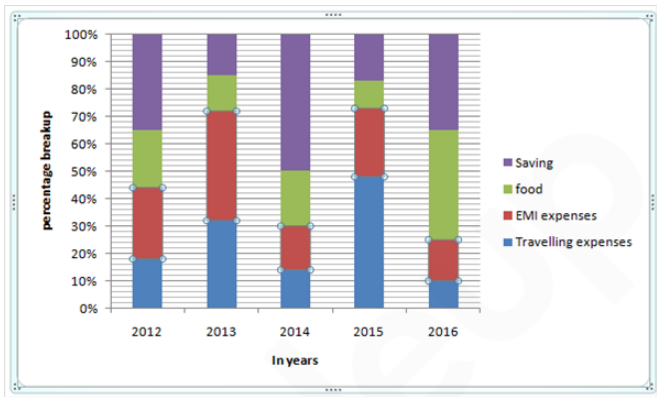
What approx. percentage of average money spend by Sunil on food to that of average money saved by him during all these years if his salary per annum was ₹ 5,00,000
1442 060a23d0a3c86b05632619055
60a23d0a3c86b05632619055- 169%false
- 266%false
- 365%false
- 470%false
- 568%true
- Show AnswerHide Answer
- Workspace
- SingleChoice
Answer : 5. "68% "
Q:Directions: The following bar graph shows the percentage breakup of a Sunil’s salary from year 2012 to 2016. With the given information, find the following questions.
If the total expenses in year 2011 is ₹ 3, 00,000 and there is an increase of 18% in 2012. Then how much Sunil has spent on travelling and EMI combine in 2012?
1409 060a23c70b1d2440614b98b90
60a23c70b1d2440614b98b90- 1₹ 92,400false
- 2₹ 1,55,760true
- 3₹ 1,53,740false
- 4₹ 1,40,330false
- 5₹ 1,50,740false
- Show AnswerHide Answer
- Workspace
- SingleChoice
Answer : 2. "₹ 1,55,760"
Q:Directions: The following bar graph shows the percentage breakup of a Sunil’s salary from year 2012 to 2016. With the given information, find the following questions.
Every year there is an increase of 100% in monthly salary as compared to previous year’s monthly salary then what is the ratio of monthly salary in 2016 to the expenses on travelling in 2013.
1892 060a23bac3c86b05632618f76
60a23bac3c86b05632618f76- 180:3false
- 225:1true
- 38:1false
- 41:25false
- 5None of thesefalse
- Show AnswerHide Answer
- Workspace
- SingleChoice
Answer : 2. "25:1"
Q:Directions: The following bar graph shows the percentage breakup of a Sunil’s salary from year 2012 to 2016. With the given information, find the following questions.
If the saving in 2012 is 4/5th of the saving in 2014. Then what is the total expenditure spent on food in 2012? (Given that total expense in 2014 is ₹ 1,85,000)
1626 060a23b25b1d2440614b98a08
60a23b25b1d2440614b98a08- 1₹ 21,100false
- 2₹ 45,100false
- 3₹ 40,400false
- 4₹ 44,400true
- 5None of thesefalse
- Show AnswerHide Answer
- Workspace
- SingleChoice
Answer : 4. "₹ 44,400"
Q:Directions: The following bar graph shows the percentage breakup of a Sunil’s salary from year 2012 to 2016. With the given information, find the following questions.
If the ratio on saving in the year 2013 and 2016 are in the ratio 3 : 5. Then what is the ratio of EMI expenses in the year 2013 and 2016.
1327 060a239cab1d2440614b9885b
60a239cab1d2440614b9885b- 18:15false
- 256:15true
- 356:5false
- 4Can’t be determinedfalse
- 5None of thesefalse
- Show AnswerHide Answer
- Workspace
- SingleChoice