Maths Practice Question and Answer
8 Q:Study the following bar chart and answer the questions carefully.
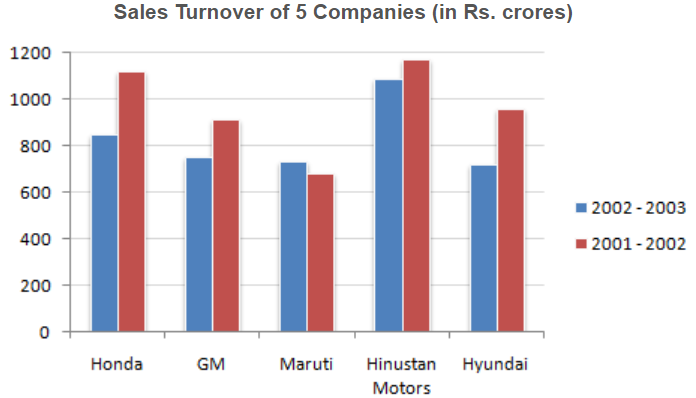
What should have been the sales turnover of GM in 2002 - 2003 to have shown an excess of the same quantum over 2001 - 2002 as shown by the sales turnover of Maruti ?
1519 05fd342d1eddcb86a7ee3e613
5fd342d1eddcb86a7ee3e613- 1953.76false
- 2963.76false
- 3952.76false
- 4962.76true
- 5None of thesefalse
- Show AnswerHide Answer
- Workspace
- SingleChoice
Answer : 4. "962.76"
Q:Study the following bar chart and answer the questions carefully.
Which of the companies shows the maximum percentage difference in sales turnover between the two years ?
1437 05fd33b8ec46a213fc5c4fe25
5fd33b8ec46a213fc5c4fe25- 1Hondafalse
- 2GMfalse
- 3Hyundaitrue
- 4Marutifalse
- 5None of thesefalse
- Show AnswerHide Answer
- Workspace
- SingleChoice
Answer : 3. "Hyundai"
Q:Study the following bar chart and answer the questions carefully.
What is the absolute change in overall sales turnover of the five companies together between 2001 - 2002 and 2002 - 2003 ?
1915 05fd33b3cc46a213fc5c4fc25
5fd33b3cc46a213fc5c4fc25- 1712.43true
- 2142.48false
- 3683.53false
- 4655.56false
- 5None of thesefalse
- Show AnswerHide Answer
- Workspace
- SingleChoice
Answer : 1. "712.43"
Q:Study the following bar chart and answer the questions carefully.
What is the percentage change in the overall sales turnover of the five companies together between 2001 - 2002 and 2002 - 2003 ?
1829 05fd33a80eddcb86a7ee3ab40
5fd33a80eddcb86a7ee3ab40- 117.21 %false
- 214.68 %true
- 312.67 %false
- 421.24 %false
- 522.33 %false
- Show AnswerHide Answer
- Workspace
- SingleChoice
Answer : 2. "14.68 %"
Q:Directions :- Refer the graph and answer the given questions.
The following line graph shows the number of products sold by company A and B during six years.
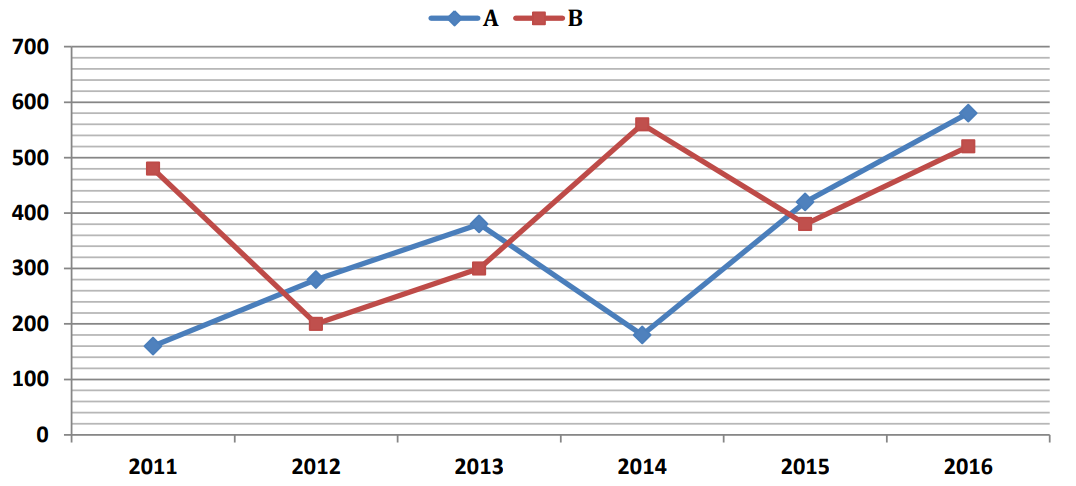
The number of products sold by B increased by what percent from 2011 and 2014 ?
1350 05fd32f2bd82ef86315b71216
5fd32f2bd82ef86315b71216The following line graph shows the number of products sold by company A and B during six years.
- 1$$ {14{2\over3}\%}$$false
- 2$$ {16{2\over3}\%}$$true
- 3$$ {24{2\over3}\%}$$false
- 4$$ {18{2\over3}\%}$$false
- 5$$ {25{1\over3}\%}$$false
- Show AnswerHide Answer
- Workspace
- SingleChoice
Answer : 2. "$$ {16{2\over3}\%}$$"
Q:Directions :- Refer the graph and answer the given questions.
The following line graph shows the number of products sold by company A and B during six years.
Out of the total number of products sold by A and B together in 2011, only 20% are defected. What is the total number of defected products sold by A and B together in 2011?
1145 05fd32e77956cb668fbdd9206
5fd32e77956cb668fbdd9206The following line graph shows the number of products sold by company A and B during six years.
- 1228false
- 2128true
- 3160false
- 4148false
- 5138false
- Show AnswerHide Answer
- Workspace
- SingleChoice
Answer : 2. "128"
Q:Directions :- Refer the graph and answer the given questions.
The following line graph shows the number of products sold by company A and B during six years.
What is the ratio of the total number of products sold by A and B together in 2012 to the total number of products sold in these two companies together in 2015 ?
1445 05fd32c9ac46a213fc5c46b19
5fd32c9ac46a213fc5c46b19The following line graph shows the number of products sold by company A and B during six years.
- 112 : 25false
- 23 : 5true
- 34 : 3false
- 45 : 3false
- 5None of thesefalse
- Show AnswerHide Answer
- Workspace
- SingleChoice
Answer : 2. "3 : 5"
Q: Direction: Equation number I and II are given. You have to solve both the question and answer.
$$ {I.x^{2}={144}}$$
$$ {II.y^{2}-24y+144=0}$$
1240 05fd323e1956cb668fbdd677e
5fd323e1956cb668fbdd677e$$ {I.x^{2}={144}}$$
$$ {II.y^{2}-24y+144=0}$$
- 1x ≤ ytrue
- 2x ≥ yfalse
- 3Relation between x and y cannot be determinedfalse
- 4x ˂ yfalse
- 5x > yfalse
- Show AnswerHide Answer
- Workspace
- SingleChoice