Maths Practice Question and Answer
8 Q: Pulse is now being sold at Rs. 20 a kg. During last month its rate was Rs. 16 per kg. By how much percent should a family reduce its consumption so as to keep the expenditure fixed?
7901 05f589c78c93f325a6769a644
5f589c78c93f325a6769a644- 125%false
- 220%true
- 310%false
- 435%false
- Show AnswerHide Answer
- Workspace
- SingleChoice
Answer : 2. "20%"
Q: A tank contains a mixture of 80 litre of milk and water. 70% of the milk and 30% of the water are drawn, therefore 55% part of the tank become empty. Find the initial quantity of milk and water in the tank.
3505 05f589bef93cd323636091386
5f589bef93cd323636091386- 150 litre , 30 litretrue
- 230 litre, 50 litrefalse
- 320 litre, 60 litrefalse
- 4None of thesefalse
- Show AnswerHide Answer
- Workspace
- SingleChoice
Answer : 1. "50 litre , 30 litre"
Q: If sin3θ=cos(20° - θ) then find out the value of θ.
1763 05f589a1f2025ff52f0526ecf
5f589a1f2025ff52f0526ecf- 140°false
- 235°true
- 360°false
- 430°false
- Show AnswerHide Answer
- Workspace
- SingleChoice
Answer : 2. "35°"
Q:Directions : The graph shows the demand and production of different companies. Study the graph and answer the following questions.
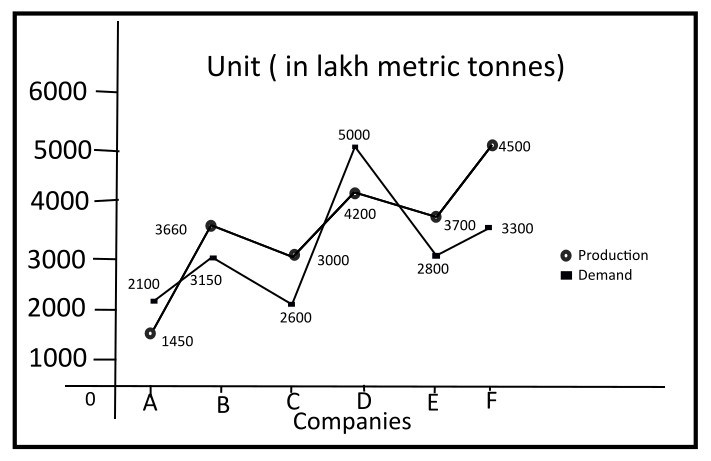
What is the lowest production company?
1259 05f4f73630c72eb2349337ad6
5f4f73630c72eb2349337ad6- 1Cfalse
- 2Dfalse
- 3Ffalse
- 4Atrue
- Show AnswerHide Answer
- Workspace
- SingleChoice
Answer : 4. "A"
Q:Directions : The graph shows the demand and production of different companies. Study the graph and answer the following questions.
What is the second large demand company?
1371 05f4f730882a7582d892c7ab9
5f4f730882a7582d892c7ab9- 1Ftrue
- 2Bfalse
- 3Afalse
- 4Dfalse
- Show AnswerHide Answer
- Workspace
- SingleChoice
Answer : 1. "F"
Q:Directions : The graph shows the demand and production of different companies. Study the graph and answer the following questions.
The production of company A is approximately what percent of the demand of company C?
1186 05f4f72990c72eb234933723c
5f4f72990c72eb234933723c- 150%false
- 260%false
- 355 %true
- 465%false
- Show AnswerHide Answer
- Workspace
- SingleChoice
Answer : 3. "55 %"
Q:Directions : The graph shows the demand and production of different companies. Study the graph and answer the following questions.
The demand of company B is what percentage of the production of company F ?
1519 05f4f72000c72eb2349336a22
5f4f72000c72eb2349336a22- 150%false
- 270%true
- 380%false
- 460%false
- Show AnswerHide Answer
- Workspace
- SingleChoice
Answer : 2. "70%"
Q:Directions : The graph shows the demand and production of different companies. Study the graph and answer the following questions.
What is the ratio of companies with high demand to production and companies with less than production?
1476 05f4f71b87e85226ee74c45d7
5f4f71b87e85226ee74c45d7- 11:2true
- 22:3false
- 32:1false
- 43:2false
- Show AnswerHide Answer
- Workspace
- SingleChoice