Maths Practice Question and Answer
8 Q: Two numbers are in the ratio of 3: 5. If 9 be subtracted from each, then they are in the ratio of 12: 23. Find the numbers.
1738 05f47999a09e4377de945e3b0
5f47999a09e4377de945e3b0- 133,55true
- 260,69false
- 315,28false
- 436,115false
- Show AnswerHide Answer
- Workspace
- SingleChoice
Answer : 1. "33,55 "
Q: A businessman bought an article and sold it at a loss of 5%. If he had bought it for 10% less and sold it for Rs. 33 more, he would have had a profit of 30%. The cost price of the article is
1640 05f4796a50c2ab956ca0d59fe
5f4796a50c2ab956ca0d59fe- 1Rs. 150true
- 2Rs. 300false
- 3Rs. 330false
- 4Rs. 155false
- Show AnswerHide Answer
- Workspace
- SingleChoice
Answer : 1. "Rs. 150 "
Q: The compound interest on Rs.30,000 at 7% per annum is Rs. 4347. The period (in years) is:
1613 05ecf41f8a7365b2f4ce2021b
5ecf41f8a7365b2f4ce2021b- 12½false
- 23false
- 32true
- 44false
- Show AnswerHide Answer
- Workspace
- SingleChoice
Answer : 3. "2"
Explanation :
We know that
$$ {A=P{(1+{r\over 100}})}^{t}$$
Putting the value we can get answer
Q: Manu works 3 times as fast as Raju. If Raju can complete a job alone in 60 days, then in how many days can they together finish the job?
1596 05f3f93d89b782961da390365
5f3f93d89b782961da390365- 17 daysfalse
- 24 daysfalse
- 35 daysfalse
- 415 daystrue
- Show AnswerHide Answer
- Workspace
- SingleChoice
Answer : 4. "15 days"
Q:Directions: The following graph gives Sales, Expense and Capital of a company for a period of five years 1994 to 1998. Read the graph and answer the following questions.
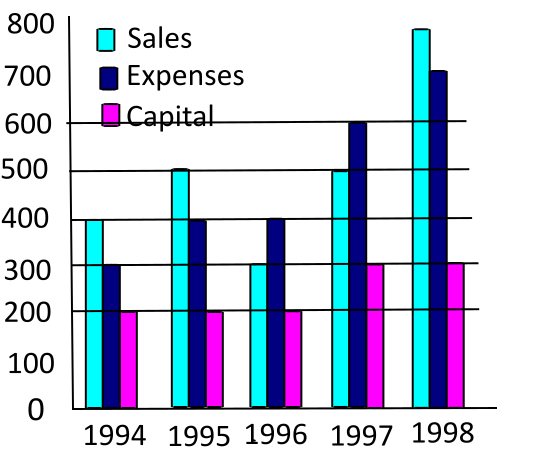
In which year was the ratio of sales to capital the lowest?
1441 05f40e6549b782961da3f964a
5f40e6549b782961da3f964a- 11998false
- 21997false
- 31996true
- 41995false
- Show AnswerHide Answer
- Workspace
- SingleChoice
Answer : 3. "1996"
Q:Directions: The following graph gives Sales, Expense and Capital of a company for a period of five years 1994 to 1998. Read the graph and answer the following questions.
In which year was the ratio of profits to capital the highest?
1332 05f40e5d69b782961da3f9518
5f40e5d69b782961da3f9518- 11998false
- 21995true
- 31996false
- 41997false
- Show AnswerHide Answer
- Workspace
- SingleChoice
Answer : 2. "1995"
Q:Directions: The following graph gives Sales, Expense and Capital of a company for a period of five years 1994 to 1998. Read the graph and answer the following questions.
What was the average per annum increase in sales (in Rs. Cr.) from 1994 to 1998?
1363 05f40e3984c9a9415f7ce2acd
5f40e3984c9a9415f7ce2acd- 150false
- 260false
- 380true
- 4100false
- Show AnswerHide Answer
- Workspace
- SingleChoice
Answer : 3. "80"
Q:Directions: The following graph gives Sales, Expense and Capital of a company for a period of five years 1994 to 1998. Read the graph and answer the following questions.
In which year was the Sales to Expense ratio the lowest?
1480 05f40e2e89b782961da3f873c
5f40e2e89b782961da3f873c- 11994false
- 21996true
- 31997false
- 41998false
- Show AnswerHide Answer
- Workspace
- SingleChoice