


Maths Practice Question and Answer
8 Q: The compound interest on a certain sum of money for 2 years at 5% per annum is Rs. 410. The simple interest on the same sum at the same rate and for the same time is-
1496 0609a66824587a93a1dc85718
609a66824587a93a1dc85718- 1Rs. 350false
- 2Rs. 405false
- 3Rs. 400true
- 4Rs. 300false
- Show AnswerHide Answer
- Workspace
- SingleChoice
Answer : 3. "Rs. 400"
Q: A sum of ₹1,50,000 is distributed among three persons - A, B and C - so that they receive 20%, 30% and 50%. respectively. A receives the same amount from another sum of money which is distributed among them so that they receive 50%, 30% and 20%, respectively. Find the total amount received from both sums of money, by B.
1496 064ccdd1f8f85ca71558f091a
64ccdd1f8f85ca71558f091a- 1₹58,000false
- 2₹ 60,000false
- 3₹ 55,000false
- 4₹ 63,000true
- Show AnswerHide Answer
- Workspace
- SingleChoice
Answer : 4. "₹ 63,000"
Q: Alloy A contains metals x and y only in the ratio 5: 2 and alloy B contains these metals in the ratio 3: 4. Alloy C is prepared by mixing A and B in the ratio 4: 5. The percentage of x in alloy C is:
1496 064c76a993fde307e3f4acc19
64c76a993fde307e3f4acc19- 145false
- 2$$55{5\over 9}$$true
- 3$$44{4\over 9}$$false
- 456false
- Show AnswerHide Answer
- Workspace
- SingleChoice
Answer : 2. "$$55{5\over 9}$$"
Q:Direction: Study the line graph carefully to answer the following questions.
Line graph shows the production (in thousand units) and percentage of exported mobiles, computers and laptops.
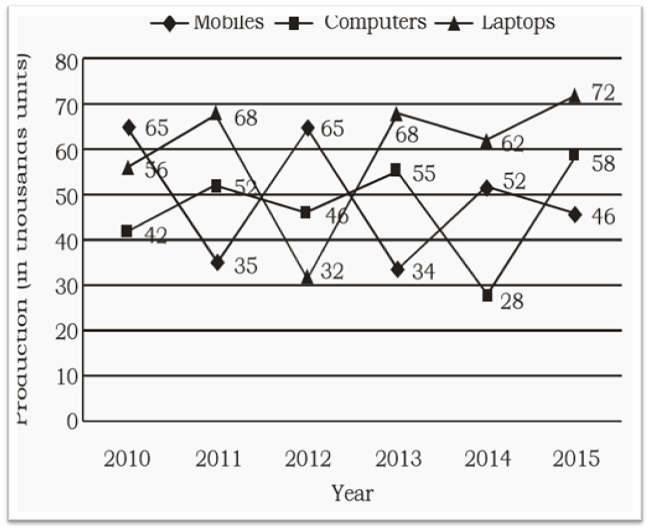
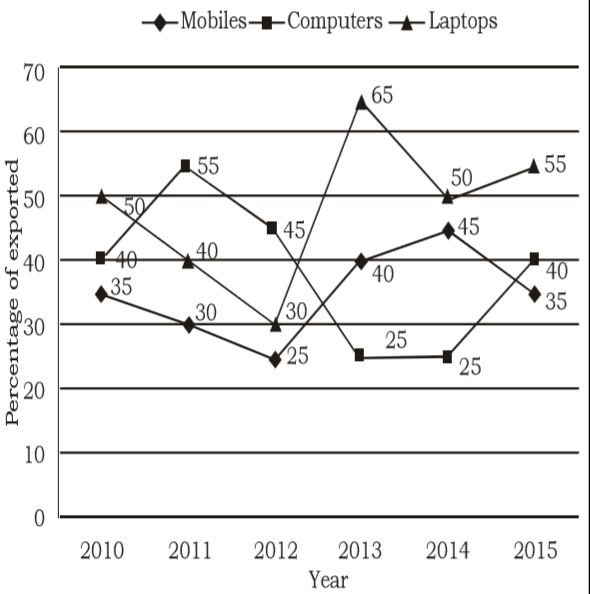
Find the ratio between Mobiles, Laptops and Computers exported in the year 2012.
1495 05e9d1e23772f97276f50a277
5e9d1e23772f97276f50a277Line graph shows the production (in thousand units) and percentage of exported mobiles, computers and laptops.
- 1325 : 316: 419false
- 2325 : 192 : 414true
- 3319 : 216:425false
- 4256 : 355 : 135false
- 5None of thesefalse
- Show AnswerHide Answer
- Workspace
- SingleChoice
Answer : 2. "325 : 192 : 414"
Q:Directions: The following graph gives Sales, Expense and Capital of a company for a period of five years 1994 to 1998. Read the graph and answer the following questions.
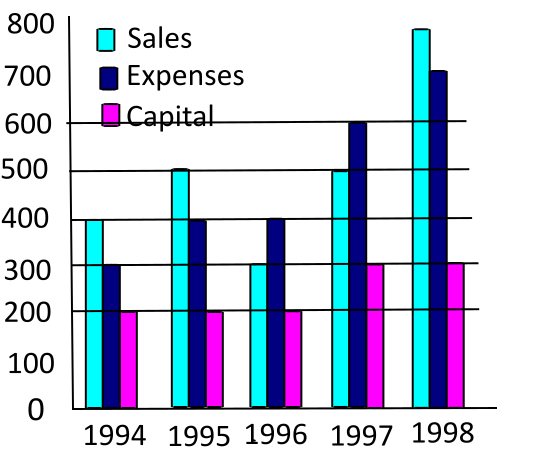
What was the average per annum increase in sales (in Rs. Cr.) from 1994 to 1998?
1495 05f40e3984c9a9415f7ce2acd
5f40e3984c9a9415f7ce2acd- 150false
- 260false
- 380true
- 4100false
- Show AnswerHide Answer
- Workspace
- SingleChoice
Answer : 3. "80"
Q:Directions: The bar chart given below shows the percentage distribution of the production of various models of a mobile manufacturing company in 2007 and 2008. The total production in 2007 was 35 lakh mobile phones and in 2008 the production was 44 lakh. Study the chart and answer the following questions.
Percentage of six different types of mobiles manufactured by a company over two year
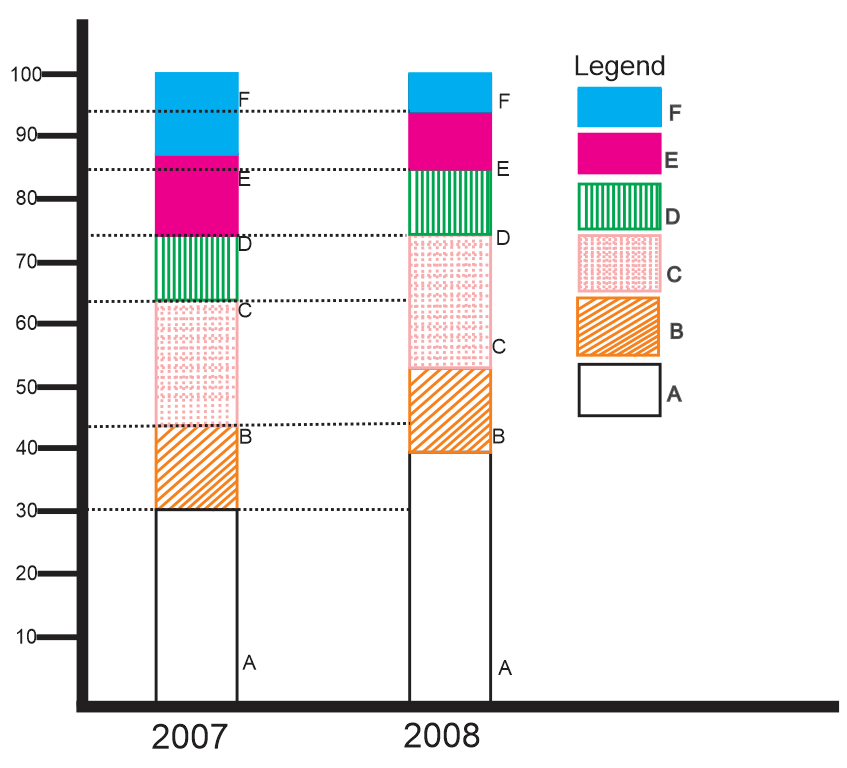
Total number of mobiles of models A, B and E manufactured in 2007 was
1495 05dd6828a00a9284b722e987b
5dd6828a00a9284b722e987bPercentage of six different types of mobiles manufactured by a company over two year
- 124,50,000false
- 222,75,00false
- 321,00,000true
- 419,25,00false
- Show AnswerHide Answer
- Workspace
- SingleChoice
Answer : 3. "21,00,000 "
Q: If the price of tickets is increased in the ratio 8 : 11 then the number of tickets sold falls in the ratio 23 : 21 then what is the increase in the revenue, if the revenue before the increase in the price of the ticket was Rs 36,800 ?
1495 06321c1a664c0411bf18af393
6321c1a664c0411bf18af393- 1Rs 21250false
- 2Rs 9400true
- 3Rs 7850false
- 4Rs 12850false
- Show AnswerHide Answer
- Workspace
- SingleChoice
Answer : 2. "Rs 9400"
Q: The difference between the selling prices of an article at a profit of 15% and at a profit of 10% is Rs.10. The cost price of the article is -
1495 060361d00a0666c3c85056f10
60361d00a0666c3c85056f10- 1Rs.150false
- 2Rs.200true
- 3Rs.100false
- 4Rs.120false
- Show AnswerHide Answer
- Workspace
- SingleChoice