Maths Practice Question and Answer
8 Q:Directions: Following is the pie-chart showing the spending of a family on various items in a particular year
Study the pie chart and answer questions
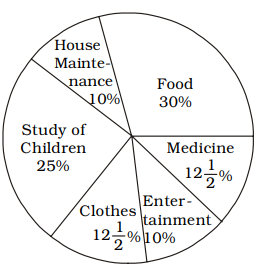
If the total amount spent on the family during the year was ₹ 35,000, the amount spent for study of children and food together was
851 063be6fa261d62119f1dbc4a2
63be6fa261d62119f1dbc4a2- 119,250true
- 219,500false
- 319,750false
- 419,850false
- Show AnswerHide Answer
- Workspace
- SingleChoice
Answer : 1. "19,250 "
Q:Directions: The following Pie Chart shows the export of different food grains from India in 2010. Study the chart and answer the questions:
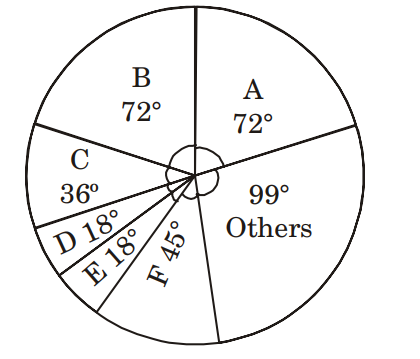
If the revenue from 1 quintal of crop A is thrice that from 1 quintal of crop C, then the ratio of the total revenues of A and C is
850 063be6b9f1b93047bc20cdf06
63be6b9f1b93047bc20cdf06- 11 : 6false
- 22 : 3false
- 33 : 2false
- 46 : 1true
- Show AnswerHide Answer
- Workspace
- SingleChoice
Answer : 4. "6 : 1"
Q: In △ABC, D and E are the mid points of sides BC and AC, respectively. If AD = 10.8 cm, BE = 14.4 cm and AD and BE intersect at G at a right angle, then the area (in cm2) of △ABC is:
850 064bfb8efc3da05b2214f4d20
64bfb8efc3da05b2214f4d20- 1103.68true
- 253.76false
- 380.64false
- 456.76false
- Show AnswerHide Answer
- Workspace
- SingleChoice
Answer : 1. "103.68"
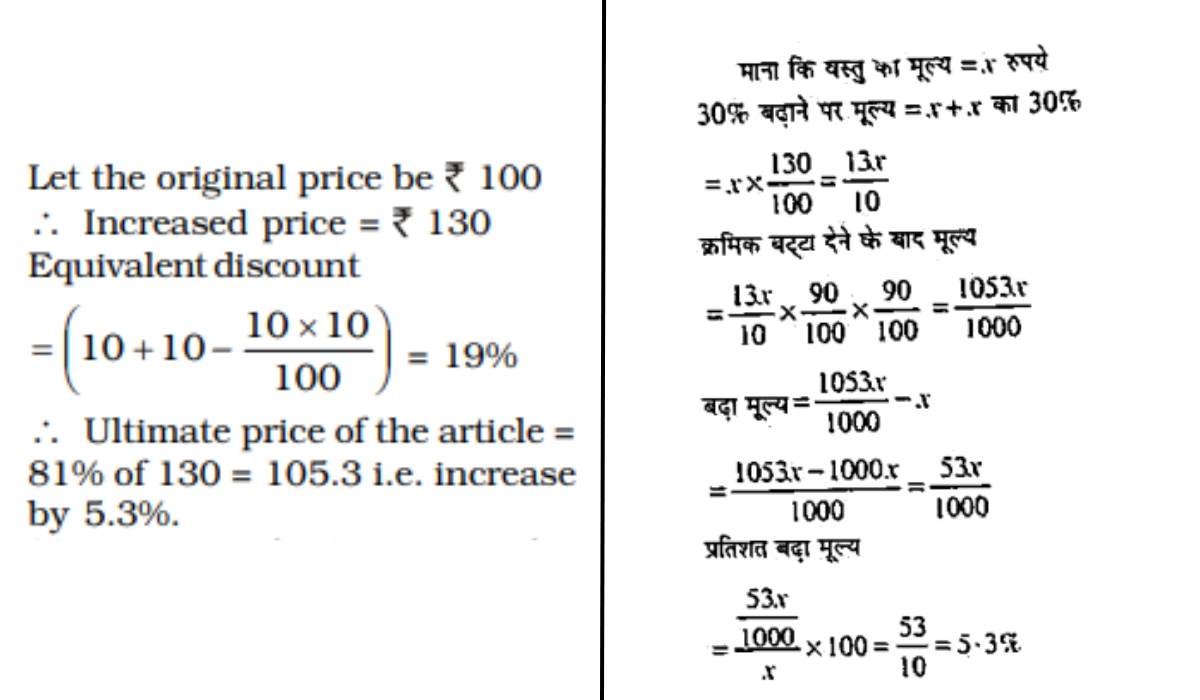
Q: The price of an article is raised by 30% and then two successive discounts of 10% each are allowed. Ultimately the price of the article is
850 0624d53016dc29f5ccd0e7252
624d53016dc29f5ccd0e7252- 1decreased by 3%false
- 2decreased by 5.3%false
- 3increased by 10%false
- 4increased by 5.3%true
- Show AnswerHide Answer
- Workspace
- SingleChoice
Answer : 4. "increased by 5.3% "
Explanation :
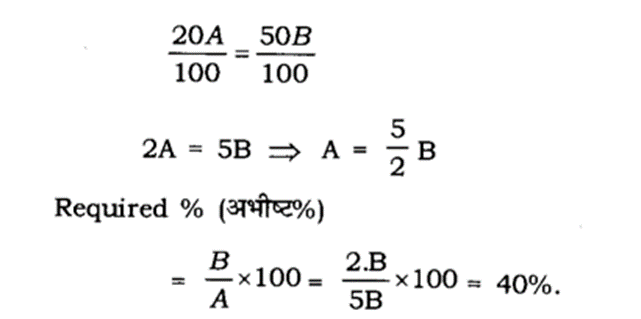
Q: if 20% of A = 50% of B, then what percentage of A is B?
849 0653f7f0ac298bbcb027ef17a
653f7f0ac298bbcb027ef17a- 130%false
- 240%true
- 325%false
- 415%false
- Show AnswerHide Answer
- Workspace
- SingleChoice
Answer : 2. "40%"
Explanation :
Q:Directions: Study the Bar diagram carefully and answer the questions.
The Bar diagram shows the trends of foreign direct investment (FDI) into India from all over the World (in Rs. crores).
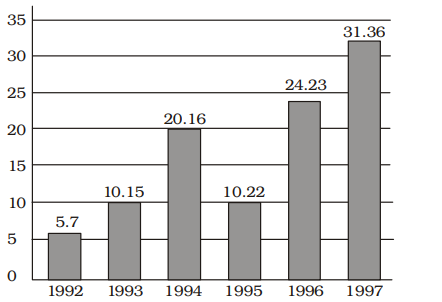
The ratio of investment in 1997 to the average investment is
848 063a56accbe1dca1b35d2e916
63a56accbe1dca1b35d2e916 - 12 : 1true
- 21 : 2false
- 31 : 1false
- 43 : 1false
- Show AnswerHide Answer
- Workspace
- SingleChoice
Answer : 1. "2 : 1"
Q:Direction: Read the following graph carefully and answer the following questions:
The following bar graph shows the quantity(in kg) of wheat, rice, pulses and salts sold by two companies P and Q in the month of January.
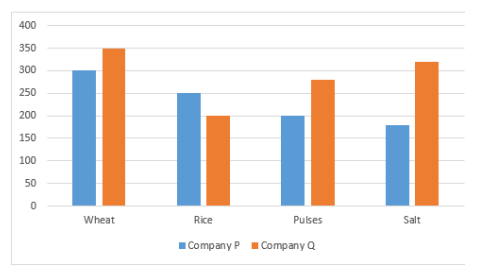
What is the difference between the quantity of salts sold by company P and Q together and the quantity of wheat sold by company P?
848 064ddf51d462ecdc3adb97191
64ddf51d462ecdc3adb97191The following bar graph shows the quantity(in kg) of wheat, rice, pulses and salts sold by two companies P and Q in the month of January.
- 190 kgfalse
- 2200 kgtrue
- 3150 kgfalse
- 4160 kgfalse
- 580 kgfalse
- Show AnswerHide Answer
- Workspace
- SingleChoice
Answer : 2. "200 kg"
Q:Directions: The table given here shows the production of five types of cars by a company in the year 1989 to 1994. Study the table and answer questions.
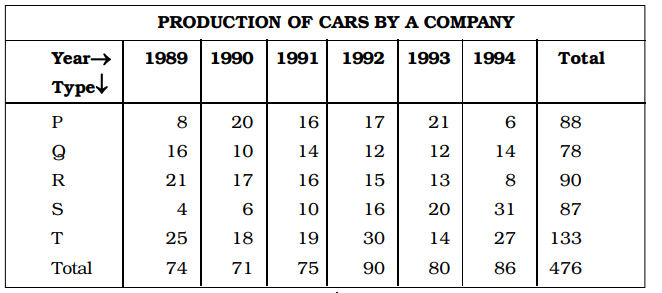
The percent increased in total production of all types of cars in1992 to that in 1991 was :
847 0632db3615c208a6bf7f2677e
632db3615c208a6bf7f2677e- 115%false
- 220%true
- 325%false
- 430%false
- Show AnswerHide Answer
- Workspace
- SingleChoice