Maths Practice Question and Answer
8 Q:Answer the following questions
If 35% of a number is subtracted from the second number the second number reduces to its four–fifths. What is the ratio the first number to the second number?
714 063bd595574eba5069d4a6cc2
63bd595574eba5069d4a6cc2- 14 : 7true
- 24 : 9false
- 35 : 9false
- 45 : 7false
- Show AnswerHide Answer
- Workspace
- SingleChoice
Answer : 1. "4 : 7 "
Q: The number of coins of radius 0.75 cm and thickness 0.2cm required to be melted to make a right circular cylinder of height 8 cm and base radius 3 cm is:
714 064649fbc45f1450a80ce34be
64649fbc45f1450a80ce34be- 1500false
- 2600false
- 3460false
- 4640true
- Show AnswerHide Answer
- Workspace
- SingleChoice
Answer : 4. "640"
Q:Directions: The following Pie Chart shows the export of different food grains from India in 2010. Study the chart and answer the questions:
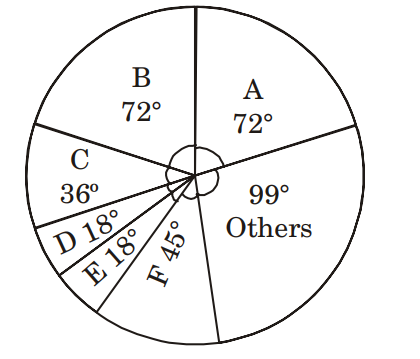
If a total of 1.5 million quintals of crop F was exported, the amount of total food grains exported (in million) quintals was
707 063be697b74eba5069d5135e8
63be697b74eba5069d5135e8- 18.7false
- 212true
- 310.8false
- 49.6false
- Show AnswerHide Answer
- Workspace
- SingleChoice
Answer : 2. "12 "
Q: How many hemispherical balls can be made from a cylinder 56 cm high and 12 cm diameter, when every ball being 0.75 cm in radius?
707 064649e5145f1450a80ce32bb
64649e5145f1450a80ce32bb- 11792false
- 23584false
- 34824false
- 47168true
- Show AnswerHide Answer
- Workspace
- SingleChoice
Answer : 4. "7168"
Q: The length of a rectangle is in- creased by 10% and breadth de- creased by 10%. Then the area of the new rectangle is:
706 06400abfd86fd4161466ab665
6400abfd86fd4161466ab665- 1neither decreased nor increasedfalse
- 2increased by 1%false
- 3decreased by 1%true
- 4decreased 10%false
- Show AnswerHide Answer
- Workspace
- SingleChoice
Answer : 3. "decreased by 1% "
Q:Direction: In the given question, two equations numbered l and II are given. Solve both the equations and mark the appropriate answer.
I. x² – 12x + 32 = 0
II. 2y² – 9y + 10 = 0
704 064dcc486d4a4292bfff45c04
64dcc486d4a4292bfff45c04II. 2y² – 9y + 10 = 0
- 1x > ytrue
- 2x < yfalse
- 3x ≥ yfalse
- 4x ≤ yfalse
- 5x = y or the relationship between x and y cannot be established.false
- Show AnswerHide Answer
- Workspace
- SingleChoice
Answer : 1. "x > y"
Q:Directions : Given here is a pie chart showing the cost of gold in 2010, 2011, 2012 and 2013. Study the chart and answer the following questions
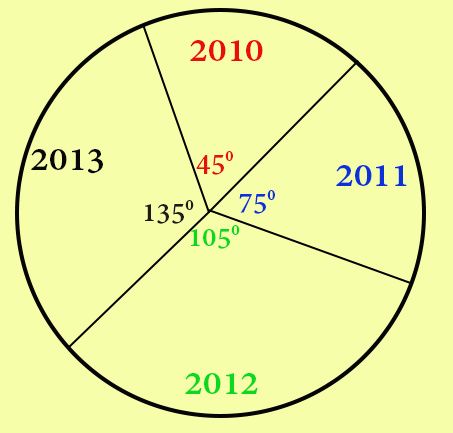
The ratio of percentage increases in price of gold from 2011 to 2012 and 2012 to 2013 is
692 064539f4739143d085f3e3c04
64539f4739143d085f3e3c04- 16 : 5false
- 27 : 5true
- 38 : 5false
- 49 : 5false
- Show AnswerHide Answer
- Workspace
- SingleChoice
Answer : 2. "7 : 5"
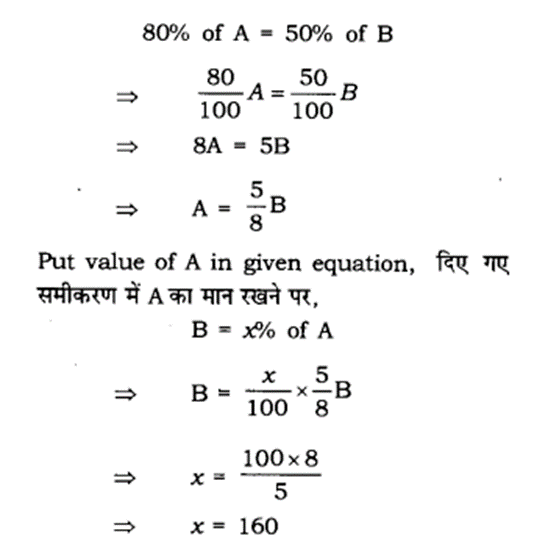
Q: If 80% of A=50% of B and B = x% of A, then the value of x is :
692 0653f6a6bae39fbcb144621e3
653f6a6bae39fbcb144621e3- 1400false
- 2300false
- 3160true
- 4150false
- Show AnswerHide Answer
- Workspace
- SingleChoice
Answer : 3. "160"
Explanation :