


Practice Question and Answer
8 Q: undoubtedly to be(A)/ our aim(B)/ it ought (C)/ to raise the minds of the natives.(D)
2253 05f4123404c9a9415f7cf8f5d
5f4123404c9a9415f7cf8f5d- 1ADCBfalse
- 2BADCfalse
- 3CABDtrue
- 4DBACfalse
- Show AnswerHide Answer
- Workspace
- SingleChoice
Answer : 3. "CABD "
Q: Manu works 3 times as fast as Raju. If Raju can complete a job alone in 60 days, then in how many days can they together finish the job?
1848 05f3f93d89b782961da390365
5f3f93d89b782961da390365- 17 daysfalse
- 24 daysfalse
- 35 daysfalse
- 415 daystrue
- Show AnswerHide Answer
- Workspace
- SingleChoice
Answer : 4. "15 days"
Q:Directions: The following graph gives Sales, Expense and Capital of a company for a period of five years 1994 to 1998. Read the graph and answer the following questions.
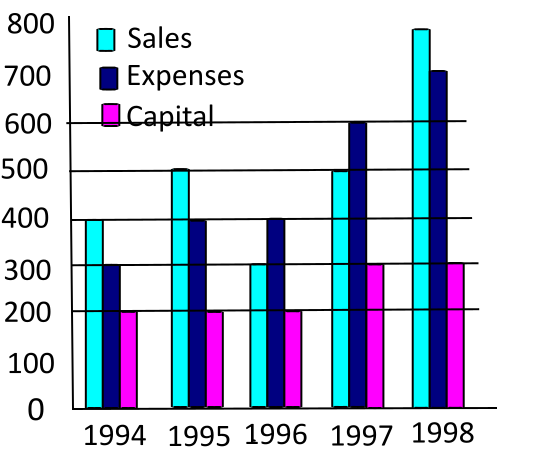
In which year was the ratio of sales to capital the lowest?
1691 05f40e6549b782961da3f964a
5f40e6549b782961da3f964a- 11998false
- 21997false
- 31996true
- 41995false
- Show AnswerHide Answer
- Workspace
- SingleChoice
Answer : 3. "1996"
Q:Directions: The following graph gives Sales, Expense and Capital of a company for a period of five years 1994 to 1998. Read the graph and answer the following questions.
In which year was the ratio of profits to capital the highest?
1512 05f40e5d69b782961da3f9518
5f40e5d69b782961da3f9518- 11998false
- 21995true
- 31996false
- 41997false
- Show AnswerHide Answer
- Workspace
- SingleChoice
Answer : 2. "1995"
Q:Directions: The following graph gives Sales, Expense and Capital of a company for a period of five years 1994 to 1998. Read the graph and answer the following questions.
What was the average per annum increase in sales (in Rs. Cr.) from 1994 to 1998?
1567 05f40e3984c9a9415f7ce2acd
5f40e3984c9a9415f7ce2acd- 150false
- 260false
- 380true
- 4100false
- Show AnswerHide Answer
- Workspace
- SingleChoice
Answer : 3. "80"
Q:Directions: The following graph gives Sales, Expense and Capital of a company for a period of five years 1994 to 1998. Read the graph and answer the following questions.
In which year was the Sales to Expense ratio the lowest?
1702 05f40e2e89b782961da3f873c
5f40e2e89b782961da3f873c- 11994false
- 21996true
- 31997false
- 41998false
- Show AnswerHide Answer
- Workspace
- SingleChoice
Answer : 2. "1996"
Q:Directions: The following graph gives Sales, Expense and Capital of a company for a period of five years 1994 to 1998. Read the graph and answer the following questions.
What has been the simple average growth rate per annum of expense between 1994 and 1998?
2422 05f40e287b8958f14fa2b6472
5f40e287b8958f14fa2b6472- 125%true
- 233%false
- 340%false
- 4130%false
- Show AnswerHide Answer
- Workspace
- SingleChoice
Answer : 1. "25%"
Q: Pipes A and B can fill a tank in 16 hours and 24 hours, respectively, and Pipe C alone can empty the full tank in x hours. All the pipes were opened together at 10:30 a.m, but C was closed at 2:30 p.m. If the tank was full at 8:30 p.m on the same day, then what is the value of x?
3149 15f40e1b2b8958f14fa2b5ee4
5f40e1b2b8958f14fa2b5ee4- 148false
- 296true
- 364false
- 445false
- Show AnswerHide Answer
- Workspace
- SingleChoice