Practice Question and Answer
8 Q:Directions : The bar graph, given here, shows the demand and production of colour televisions of five companies for Diwali season in the year 2009. Study the graph carefully and answer the questions based on the graph.
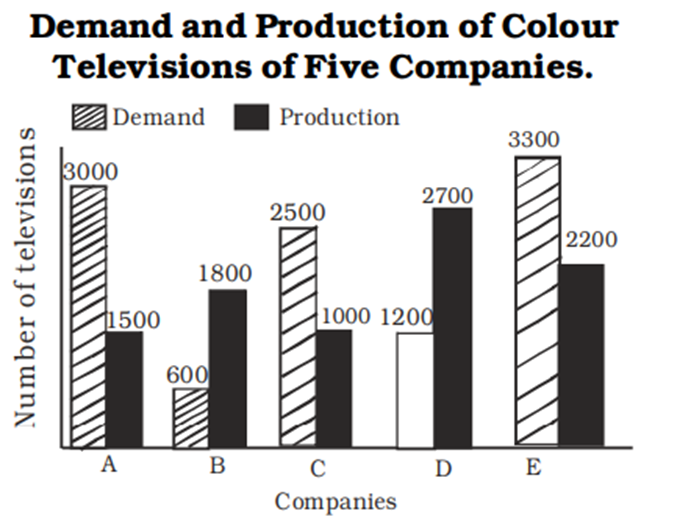
The ratio of companies having more demand than production of colour televisions to those having more production than demand is :
794 06461004c4f2cce984334e61f
6461004c4f2cce984334e61f- 12 : 3false
- 24 : 1false
- 31 :4false
- 43 : 2true
- Show AnswerHide Answer
- Workspace
- SingleChoice
Answer : 4. "3 : 2"
Q:Directions : The bar graph, given here, shows the demand and production of colour televisions of five companies for Diwali season in the year 2009. Study the graph carefully and answer the questions based on the graph.
The production of colour televisions of company D is how many times that of company A ?
731 06460fa324f2cce984334e301
6460fa324f2cce984334e301- 11.9false
- 21.8true
- 31.5false
- 42.3false
- Show AnswerHide Answer
- Workspace
- SingleChoice
Answer : 2. "1.8 "
Q:Directions : The bar graph, given here, shows the demand and production of colour televisions of five companies for Diwali season in the year 2009. Study the graph carefully and answer the questions based on the graph.
The demand of colour televisions of company B is appoximately what per cent of that of company C ?
713 06460f985cdae930acb746845
6460f985cdae930acb746845- 160%false
- 225%false
- 324%true
- 46%false
- Show AnswerHide Answer
- Workspace
- SingleChoice
Answer : 3. "24% "
Q:Directions : The bar graph, given here, shows the demand and production of colour televisions of five companies for Diwali season in the year 2009. Study the graph carefully and answer the questions based on the graph.
The ratio of the demand and production of colour televisions of company E is :
702 06460f911f75f230a7a71eb22
6460f911f75f230a7a71eb22- 13 : 2true
- 22 : 3false
- 32 : 1false
- 41 : 2false
- Show AnswerHide Answer
- Workspace
- SingleChoice
Answer : 1. "3 : 2 "
Q:Directions : Study the following bar graph and answer the questions.
company (in lakhs of rupees) for the years 1994-1997:
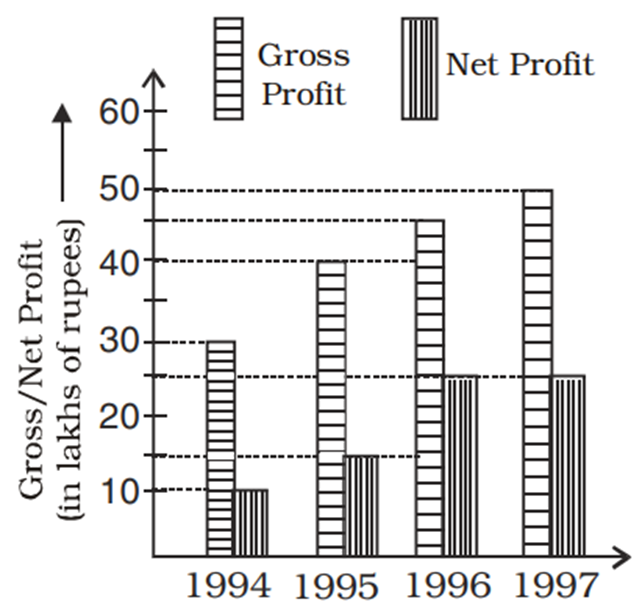
For the entire four years as shown, the ratio of total gross profit to total net profit is
903 06460f6a2cdae930acb7460a3
6460f6a2cdae930acb7460a3- 113 : 4false
- 211 : 6false
- 311 : 5true
- 49 : 4false
- Show AnswerHide Answer
- Workspace
- SingleChoice
Answer : 3. "11 : 5 "
Q:Directions : Study the following bar graph and answer the questions.
company (in lakhs of rupees) for the years 1994-1997:
The ratio of gross profit to net profit in a year was greatest in the year
784 06460f638cdae930acb746048
6460f638cdae930acb746048- 11994true
- 21995false
- 31996false
- 41997false
- Show AnswerHide Answer
- Workspace
- SingleChoice
Answer : 1. "1994 "
Q:Directions : Study the following bar graph and answer the questions.
company (in lakhs of rupees) for the years 1994-1997:
The difference of average gross profit and average net profit calculated for four years is
762 06460f5b04f2cce984334df0c
6460f5b04f2cce984334df0c- 118.75 lakhsfalse
- 219.75 lakhsfalse
- 320.5 lakhsfalse
- 422.5 lakhstrue
- Show AnswerHide Answer
- Workspace
- SingleChoice
Answer : 4. "22.5 lakhs "
Q:Directions : Study the following bar graph and answer the questions.
company (in lakhs of rupees) for the years 1994-1997:
The percentage of net profit of 1995 as compared to the gross profit in that year is
705 06460f549c899b466f4458b03
6460f549c899b466f4458b03- 125.5%false
- 235.5%false
- 337.5%true
- 442.5%false
- Show AnswerHide Answer
- Workspace
- SingleChoice