Practice Question and Answer
8 Q:Directions : Study the following bar graph and answer the questions.
company (in lakhs of rupees) for the years 1994-1997:
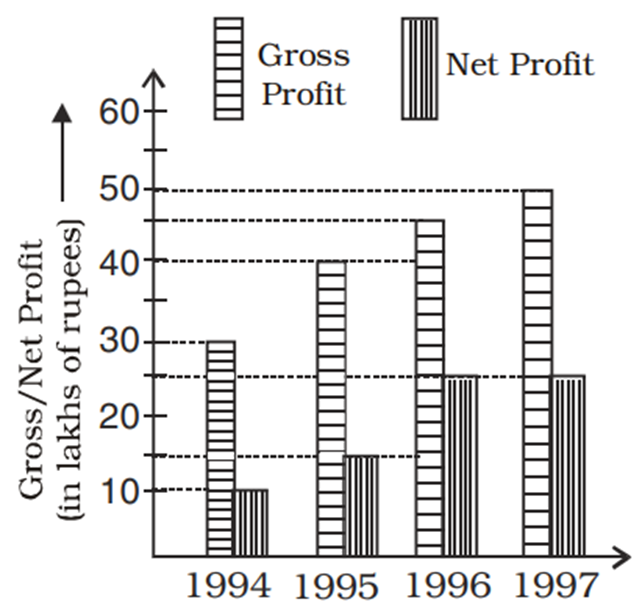
The year in which the gross profit is double the net profit
650 06460f4e7c899b466f4458a0a
6460f4e7c899b466f4458a0a- 11997true
- 21995false
- 31996false
- 41994false
- Show AnswerHide Answer
- Workspace
- SingleChoice
Answer : 1. "1997 "
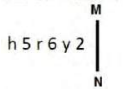
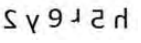
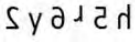
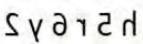
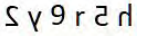
Q: select the correct mirror image of the given combination when the mirror is placed at MN as shown.
716 0645b4a34f75f230a7a62a8f8
645b4a34f75f230a7a62a8f8- 1false
- 2false
- 3true
- 4false
- Show AnswerHide Answer
- Workspace
- SingleChoice
Answer : 3. "
"
Q: P can do $${1\over 2} $$ of a work in 10 days and Q can do $${1\over 5}$$of the same work in 4 days. In how many days can both finish the work, working together?
1064 06428188232185cce3715646d
6428188232185cce3715646d- 114 daysfalse
- 210 daystrue
- 315 daysfalse
- 45 daysfalse
- Show AnswerHide Answer
- Workspace
- SingleChoice
Answer : 2. "10 days"
Q:Directions: The sub divided bar diagram given below depicts Higher secondary Students of a school for three years. Study the diagram and answer the questions

The percentage of the students passed with 2nd division in the year 2010 was
824 0645ce8abe67f3b0a568e543a
645ce8abe67f3b0a568e543a- 130%true
- 240%false
- 350%false
- 460%false
- Show AnswerHide Answer
- Workspace
- SingleChoice
Answer : 1. "30% "
Q:Directions: The sub divided bar diagram given below depicts Higher secondary Students of a school for three years. Study the diagram and answer the questions
The number of students passed with 3rd division in the year 2008 was
789 0645ce82d4d91510a5da93b1f
645ce82d4d91510a5da93b1f- 150false
- 260true
- 370false
- 480false
- Show AnswerHide Answer
- Workspace
- SingleChoice
Answer : 2. "60 "
Q:Directions: The sub divided bar diagram given below depicts Higher secondary Students of a school for three years. Study the diagram and answer the questions
In which year the school had the best result for Higher Secondary in respect of percentage of pass candidates?
842 0645ce7c7f75f230a7a679ad4
645ce7c7f75f230a7a679ad4- 12008true
- 22009false
- 32010false
- 4The percentage of pass candidates are same for the three years.false
- Show AnswerHide Answer
- Workspace
- SingleChoice
Answer : 1. "2008 "
Q:Directions: The sub divided bar diagram given below depicts Higher secondary Students of a school for three years. Study the diagram and answer the questions
The pass percentage in 2008 was
908 0645ce72c1efb290ac2461468
645ce72c1efb290ac2461468- 167%false
- 273%false
- 3$$79{2\over 3}\% $$false
- 4$$82{6\over 17}\% $$true
- Show AnswerHide Answer
- Workspace
- SingleChoice
Answer : 4. " $$82{6\over 17}\% $$"
Q:Directions: The sub divided bar diagram given below depicts Higher secondary Students of a school for three years. Study the diagram and answer the questions
The percentage passed in 1st division in 2008 was
835 0645ce5b945f1450a80b9e89d
645ce5b945f1450a80b9e89d- 127%false
- 232%false
- 3$$15{3\over 8}\% $$false
- 4$$11{13\over 17}\% $$true
- Show AnswerHide Answer
- Workspace
- SingleChoice