Practice Question and Answer
8 Q:Directions : The Bar Graph given here shows the population (in crores) of India in various census years. Observe the graph and answer the question based on it.
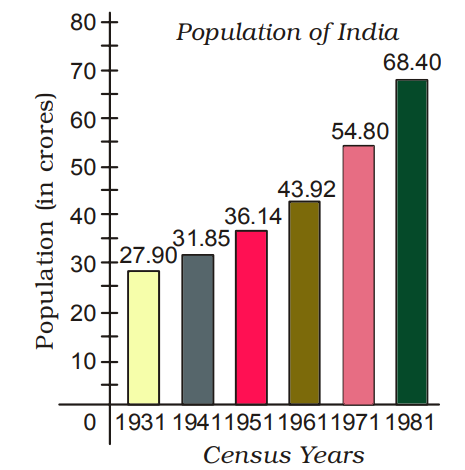
The per cent increase in population from 1971 to 1981 is
755 06453a8987f825208661904d8
6453a8987f825208661904d8- 124.8%true
- 220%false
- 316.7%false
- 422.9%false
- Show AnswerHide Answer
- Workspace
- SingleChoice
Answer : 1. "24.8% "
Q:Directions : Study the following pie chart carefully and answer the questions. The pie chart represents the percentage of people involved in various occupations.
Total number of people = 20000
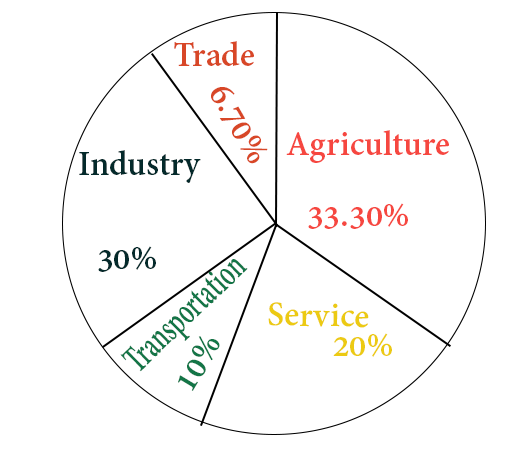
The difference between the maximum number of people involved and minimum number of people involved in various professions is
772 06453a55339143d085f3e5a73
6453a55339143d085f3e5a73Total number of people = 20000
- 12640false
- 23640false
- 36320false
- 45320true
- Show AnswerHide Answer
- Workspace
- SingleChoice
Answer : 4. "5320"
Q:Directions : Study the following pie chart carefully and answer the questions. The pie chart represents the percentage of people involved in various occupations.
Total number of people = 20000
The sectoral angle made by the people involved in service in the given pie-chart is
742 06453a4ef56b58a42369ad85f
6453a4ef56b58a42369ad85fTotal number of people = 20000
- 136°false
- 290°false
- 372°true
- 4108°false
- Show AnswerHide Answer
- Workspace
- SingleChoice
Answer : 3. "72°"
Q:Directions : Study the following pie chart carefully and answer the questions. The pie chart represents the percentage of people involved in various occupations.
Total number of people = 20000
The ratio of the people involved in service to that in industry is
780 06453a49cf3618908bf5e16b4
6453a49cf3618908bf5e16b4Total number of people = 20000
- 11 : 2false
- 22 : 3true
- 33 : 4false
- 43 : 2false
- Show AnswerHide Answer
- Workspace
- SingleChoice
Answer : 2. "2 : 3 "
Q:Directions : Study the following pie chart carefully and answer the questions. The pie chart represents the percentage of people involved in various occupations.
Total number of people = 20000
How many more people are involved in service than in trade?
934 06453a41456b58a42369ad592
6453a41456b58a42369ad592Total number of people = 20000
- 13660false
- 22660true
- 31660false
- 4660false
- Show AnswerHide Answer
- Workspace
- SingleChoice
Answer : 2. "2660 "
Q:Directions : Given here is a pie chart showing the cost of gold in 2010, 2011, 2012 and 2013. Study the chart and answer the following questions
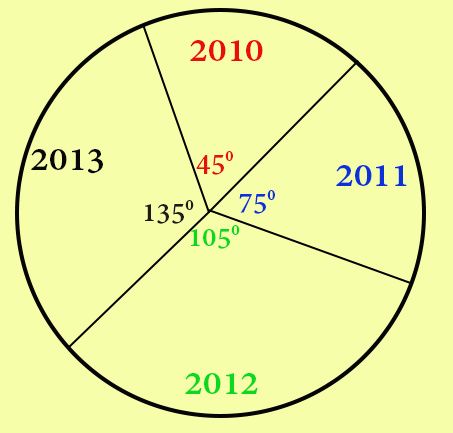
The ratio of percentage increases in price of gold from 2011 to 2012 and 2012 to 2013 is
663 064539f4739143d085f3e3c04
64539f4739143d085f3e3c04- 16 : 5false
- 27 : 5true
- 38 : 5false
- 49 : 5false
- Show AnswerHide Answer
- Workspace
- SingleChoice
Answer : 2. "7 : 5"
Q:Directions : Given here is a pie chart showing the cost of gold in 2010, 2011, 2012 and 2013. Study the chart and answer the following questions
The percentage increase in the price of gold from the year 2011 to 2013 is
771 064539e95f3618908bf5e0c4e
64539e95f3618908bf5e0c4e- 150%false
- 260%false
- 370%false
- 480%true
- Show AnswerHide Answer
- Workspace
- SingleChoice
Answer : 4. "80%"
Q:Directions : Given here is a pie chart showing the cost of gold in 2010, 2011, 2012 and 2013. Study the chart and answer the following questions
If the price of gold in 2013 is Rs. 31,500 per 10 gram, then the price of gold in 2011 per 10 gram is
843 064539c6813eb5908ae354318
64539c6813eb5908ae354318- 1Rs. 17000false
- 2Rs. 17500true
- 3Rs. 18000false
- 4Rs. 18500false
- Show AnswerHide Answer
- Workspace
- SingleChoice