Practice Question and Answer
8 Q: What is the physical layout of a computer network called?
927 063bfe6231b93047bc217cafd
63bfe6231b93047bc217cafd- 1network servicefalse
- 2network sizefalse
- 3network topologytrue
- 4network propertyfalse
- Show AnswerHide Answer
- Workspace
- SingleChoice
Answer : 3. "network topology"
Q:Directions: Following is the pie-chart showing the spending of a family on various items in a particular year
Study the pie chart and answer questions
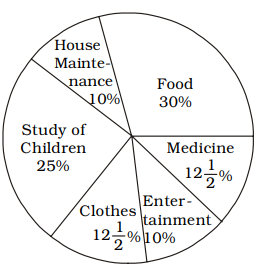
If the difference in the amount spent for buying clothes and house maintenance was ₹ 1,500, how much they spent for house maintenance?
1300 063be706261d62119f1dbc6fa
63be706261d62119f1dbc6fa- 1₹ 5,000false
- 2₹ 6,000true
- 3₹ 7,000false
- 4₹ 8,000false
- Show AnswerHide Answer
- Workspace
- SingleChoice
Answer : 2. "₹ 6,000 "
Q:Directions: Following is the pie-chart showing the spending of a family on various items in a particular year
Study the pie chart and answer questions
Angle of the pie chart representing the expenditure on entertainment is
912 063be702174eba5069d517362
63be702174eba5069d517362- 115°false
- 210°false
- 336°true
- 426°false
- Show AnswerHide Answer
- Workspace
- SingleChoice
Answer : 3. "36°"
Q:Directions: Following is the pie-chart showing the spending of a family on various items in a particular year
Study the pie chart and answer questions
If the total amount spent on the family during the year was ₹ 35,000, the amount spent for study of children and food together was
850 063be6fa261d62119f1dbc4a2
63be6fa261d62119f1dbc4a2- 119,250true
- 219,500false
- 319,750false
- 419,850false
- Show AnswerHide Answer
- Workspace
- SingleChoice
Answer : 1. "19,250 "
Q:Directions: Following is the pie-chart showing the spending of a family on various items in a particular year
Study the pie chart and answer questions
If the total amount spent on the family during the year was ₹ 50,000, how much they spent for buying clothes?
733 063be6f4861d62119f1dbc38c
63be6f4861d62119f1dbc38c- 1₹ 6,250true
- 2₹ 6,500false
- 3₹ 7,250false
- 4₹ 7,500false
- Show AnswerHide Answer
- Workspace
- SingleChoice
Answer : 1. "₹ 6,250 "
Q:Directions: Following is the pie-chart showing the spending of a family on various items in a particular year
Study the pie chart and answer questions
The ratio of the total amount spent for food and medicine is
912 063be6ef28f5b1f774c4c911f
63be6ef28f5b1f774c4c911f- 11 : 2false
- 23 : 1false
- 312 : 5true
- 411 : 5false
- Show AnswerHide Answer
- Workspace
- SingleChoice
Answer : 3. "12 : 5 "
Q:Directions: The following Pie Chart shows the export of different food grains from India in 2010. Study the chart and answer the questions:
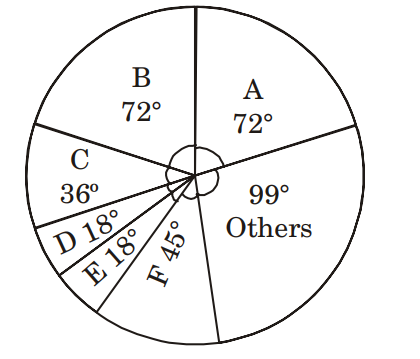
If the revenue from 1 quintal of crop A is thrice that from 1 quintal of crop C, then the ratio of the total revenues of A and C is
848 063be6b9f1b93047bc20cdf06
63be6b9f1b93047bc20cdf06- 11 : 6false
- 22 : 3false
- 33 : 2false
- 46 : 1true
- Show AnswerHide Answer
- Workspace
- SingleChoice
Answer : 4. "6 : 1"
Q:Directions: The following Pie Chart shows the export of different food grains from India in 2010. Study the chart and answer the questions:
If a total of 1.5 million quintals of crop F was exported, then the total quantity of D and E that was exported (in million quintals) was
783 063be6b4261d62119f1db985c
63be6b4261d62119f1db985c- 11.2true
- 21.5false
- 34.5false
- 46.5false
- Show AnswerHide Answer
- Workspace
- SingleChoice