Practice Question and Answer
8 Q:Directions : A graph showing the price of rice in India during the year 2000 to 2003 is given below. Study the graph carefully and answer the questions.

The month in which the price of rice were equal for the year 2000 and 2001 was
1409 06391d80a58400a550dd8e0a8
6391d80a58400a550dd8e0a8- 1Septemberfalse
- 2Augustfalse
- 3Junetrue
- 4Novemberfalse
- Show AnswerHide Answer
- Workspace
- SingleChoice
Answer : 3. "June "
Q:Directions : A graph showing the price of rice in India during the year 2000 to 2003 is given below. Study the graph carefully and answer the questions.
The range of price for a year is the difference between the maximum and the minimum prices for that year. The graph shows that this range of price was the greatest for the year
1442 06391d7ab58400a550dd8e020
6391d7ab58400a550dd8e020- 12000true
- 22001false
- 32002false
- 42003false
- Show AnswerHide Answer
- Workspace
- SingleChoice
Answer : 1. "2000 "
Q:Directions : A graph showing the price of rice in India during the year 2000 to 2003 is given below. Study the graph carefully and answer the questions.
For the month of May, the graph shows that the price of rice was the lowest in the year
1460 06391d74fb13d3250d3268a91
6391d74fb13d3250d3268a91- 12000false
- 22001false
- 32002false
- 42003true
- Show AnswerHide Answer
- Workspace
- SingleChoice
Answer : 4. "2003"
Q: Which of the following diagrams represents smokers, lawyers, non-smokers ?
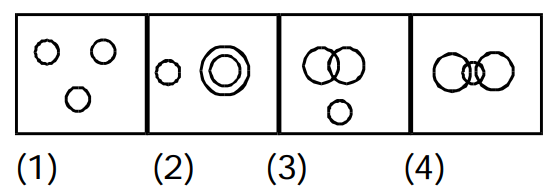
1839 06391ca7ab13d3250d325eeb6
6391ca7ab13d3250d325eeb6- 11false
- 22false
- 33false
- 44true
- Show AnswerHide Answer
- Workspace
- SingleChoice
Answer : 4. "4"
Q: Which figure represents Rhombus, Quadrilaterals, Polygons?
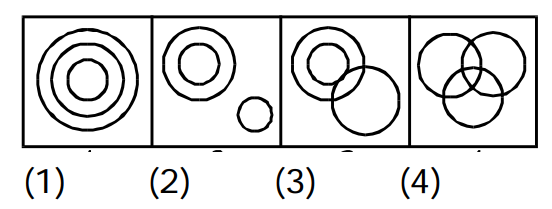
1847 06391c9f358400a550dd80e0a
6391c9f358400a550dd80e0a- 11true
- 22false
- 33false
- 44false
- Show AnswerHide Answer
- Workspace
- SingleChoice
Answer : 1. "1"
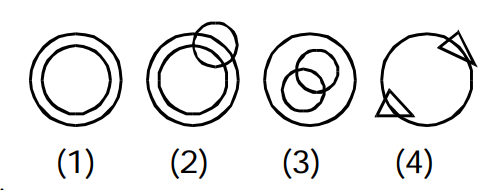
Q: Which of the following Venn Diagram gives the relationship between Friend, Guide and Philosopher ?
2241 06391c981b13d3250d325d1e0
6391c981b13d3250d325d1e0- 11false
- 22false
- 33true
- 44false
- Show AnswerHide Answer
- Workspace
- SingleChoice
Answer : 3. "3"
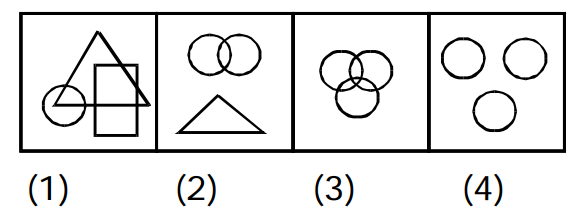
Q:Which one of the following figures represents the statement:
All the persons know English.
Few of them know Hindi also.
Those who know Hindi know Bengali.
1983 06391c8bf58400a550dd7fdb2
6391c8bf58400a550dd7fdb2Few of them know Hindi also.
Those who know Hindi know Bengali.
- 11true
- 22false
- 33false
- 44false
- Show AnswerHide Answer
- Workspace
- SingleChoice
Answer : 1. "1"
Q:Two statements are given followed by two conclusions I and II. You have to consider the two statements to be true, even if they seem to be at variance from commonly known facts. You are to decide which of the given conclusions can definitely be drawn from the given statements. Indicate your answer.
Statements:
(I) Irregularity is a cause for failure in exams.
(II) Some regular students fail in the examinations.
Conclusions:
(I) All failed students are regular.
(II) All successful students are not regular.
1643 06391c4ded319b37ca1910fa7
6391c4ded319b37ca1910fa7- 1Only I followsfalse
- 2Only II followsfalse
- 3Neither I, nor II followstrue
- 4Both I and II followfalse
- Show AnswerHide Answer
- Workspace
- SingleChoice