Aptitude Practice Question and Answer
8 Q:Answer the following questions
The total income of Ramesh, Suresh and Dinesh is Rs. 17325. Ramesh spend 70%, Suresh spend 75% and Dinesh spend 80% of their income. The ratio of their saving is 6 : 8 : 5. What is the income of Dinesh?
1043 063bd59043d35cd0deed5cdfb
63bd59043d35cd0deed5cdfb- 1Rs. 4500false
- 2Rs. 5625true
- 3Rs. 7200false
- 4Rs. 4800false
- Show AnswerHide Answer
- Workspace
- SingleChoice
Answer : 2. "Rs. 5625"
Q:Answer the following questions
A, B and C gets a total wage of Rs.3600 if they work together. A and B gets a total wage of Rs. 2800 if they work together and A alone gets Rs.1600. Find the efficiency ratio of A, B and C
1091 063bd584a3d35cd0deed5cbe8
63bd584a3d35cd0deed5cbe8- 11:2:3false
- 22:4:3false
- 34:3:2true
- 42:5:4false
- Show AnswerHide Answer
- Workspace
- SingleChoice
Answer : 3. "4:3:2"
Q:Answer the following questions
P, Q and R alone can complete a piece of work in 24, 36 and 18 days respectively. P started working, after 2 days R joins with them and Q joins with them after another 2 days, then find the no of days P, Q and R worked together.
1172 063bd571174eba5069d4a3d46
63bd571174eba5069d4a3d46- 1$$ {5{2\over 9}\ days}$$false
- 2$$ {6{2\over 9}\ days}$$true
- 3$$ {4{3\over 5}\ days}$$false
- 4None of thesefalse
- Show AnswerHide Answer
- Workspace
- SingleChoice
Answer : 2. "$$ {6{2\over 9}\ days}$$"
Q:Directions : The expenses of a country for a particular year is given in Pie–Chart. Read the Pie– Chart and answer the questions.
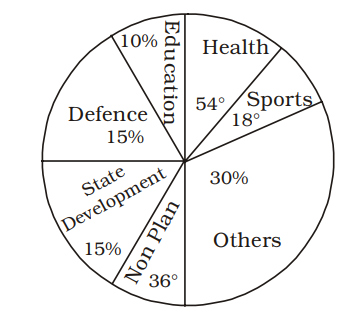
The percent of the total spending that is spent on health is
871 063ac3564fb04114b2d3cfbed
63ac3564fb04114b2d3cfbed- 115%true
- 220%false
- 325%false
- 430%false
- Show AnswerHide Answer
- Workspace
- SingleChoice
Answer : 1. "15% "
Q:Directions : The expenses of a country for a particular year is given in Pie–Chart. Read the Pie– Chart and answer the questions.
The percent of excess money spent on Others than that on Sports is
1082 063ac35174edf0d569930f9f0
63ac35174edf0d569930f9f0- 120%false
- 225%true
- 350%false
- 428%false
- Show AnswerHide Answer
- Workspace
- SingleChoice
Answer : 2. "25%"
Q:Directions : The expenses of a country for a particular year is given in Pie–Chart. Read the Pie– Chart and answer the questions.
The percent of less money spent on nonplan than that on defense is
1074 063ac34ce612ead74ab54e318
63ac34ce612ead74ab54e318- 115%false
- 25%true
- 312%false
- 410%false
- Show AnswerHide Answer
- Workspace
- SingleChoice
Answer : 2. "5% "
Q:Directions : In an Institution there are 800 students. Students use different modes of transport for going to the institution and return. The given pie diagram represents the requisite data. Study the diagram carefully and answer the questions.

If the total amount spent by the Government during the year was ₹ 3,00,000 crores, the amount spent on state development exceeds that on sports by
907 063ac34874edf0d569930f73f
63ac34874edf0d569930f73f- 1₹ 30,000 croretrue
- 2₹ 45,000 crorefalse
- 3₹ 35,000 crorefalse
- 4₹ 25,000 crorefalse
- Show AnswerHide Answer
- Workspace
- SingleChoice
Answer : 1. "₹ 30,000 crore "
Q:Directions : The expenses of a country for a particular year is given in Pie–Chart. Read the Pie– Chart and answer the questions.
If the total amount spent by the Government during the year was ₹ 1,00,000 crores, then the amount spent on Health and Education together was
866 063ac3433612ead74ab54df8b
63ac3433612ead74ab54df8b- 1₹ 25,000 croretrue
- 2₹ 20,000 crorefalse
- 3₹ 30,000 crorefalse
- 4₹ 15,000 crorefalse
- Show AnswerHide Answer
- Workspace
- SingleChoice