Aptitude Practice Question and Answer
8 Q:Directions : The following graph shows production (in thousands) of two types (P and Q) of vehicles by a factory over the years 2009 to 2014. Study the graph and answer the given questions.
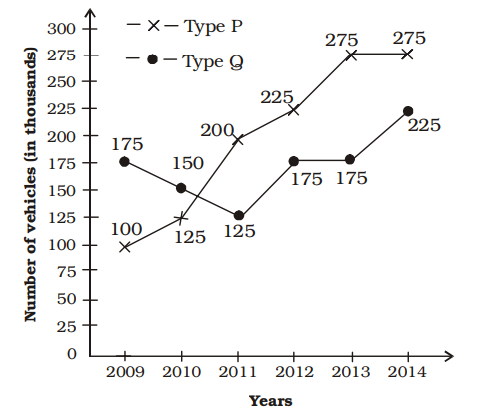
The ratio of total production of Type P vehicles to total production of type Q vehicles over the years is
785 063a56da8b580da5a6237fd52
63a56da8b580da5a6237fd52 - 148 : 41true
- 25 : 8false
- 35 : 8false
- 441 : 48false
- Show AnswerHide Answer
- Workspace
- SingleChoice
Answer : 1. "48 : 41 "
Q:Directions : The following graph shows production (in thousands) of two types (P and Q) of vehicles by a factory over the years 2009 to 2014. Study the graph and answer the given questions.
The total production of Type P vehicles in the years 2009 and 2011 is what percent of total production of Type Q vehicles in 2010 and 2014?
755 063a56d3024e8fb08b9fe2176
63a56d3024e8fb08b9fe2176 - 175false
- 269.25false
- 380true
- 481.25false
- Show AnswerHide Answer
- Workspace
- SingleChoice
Answer : 3. "80 "
Q:Directions : The following graph shows production (in thousands) of two types (P and Q) of vehicles by a factory over the years 2009 to 2014. Study the graph and answer the given questions.
In how many of the given years, was the production of Type P vehicles of the company more than the average production of this type vehicles in the given years?
820 063a56c9824e8fb08b9fe1f85
63a56c9824e8fb08b9fe1f85 - 13true
- 24false
- 32false
- 45false
- Show AnswerHide Answer
- Workspace
- SingleChoice
Answer : 1. "3 "
Q:Directions: Study the Bar diagram carefully and answer the questions.
The Bar diagram shows the trends of foreign direct investment (FDI) into India from all over the World (in Rs. crores).
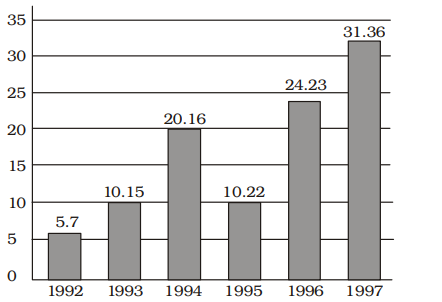
The absolute difference in FDI to India between 1996 and 1997 is
977 063a56b4a8fc9692134068f38
63a56b4a8fc9692134068f38 - 1Rs. 7.29 croresfalse
- 2Rs. 7.13 crorestrue
- 3Rs. 7.16 croresfalse
- 4Rs. 7.22 croresfalse
- Show AnswerHide Answer
- Workspace
- SingleChoice
Answer : 2. "Rs. 7.13 crores "
Q:Directions: Study the Bar diagram carefully and answer the questions.
The Bar diagram shows the trends of foreign direct investment (FDI) into India from all over the World (in Rs. crores).
The ratio of investment in 1997 to the average investment is
853 063a56accbe1dca1b35d2e916
63a56accbe1dca1b35d2e916 - 12 : 1true
- 21 : 2false
- 31 : 1false
- 43 : 1false
- Show AnswerHide Answer
- Workspace
- SingleChoice
Answer : 1. "2 : 1"
Q:Directions: Study the Bar diagram carefully and answer the questions.
The Bar diagram shows the trends of foreign direct investment (FDI) into India from all over the World (in Rs. crores).
The year which exhibited the 2nd highest growth percentage in FDI in India over the period shown is
728 063a56a668fc9692134068b08
63a56a668fc9692134068b08 - 11993false
- 21994false
- 31997false
- 41996true
- Show AnswerHide Answer
- Workspace
- SingleChoice
Answer : 4. "1996"
Q:Directions: Study the Bar diagram carefully and answer the questions.
The Bar diagram shows the trends of foreign direct investment (FDI) into India from all over the World (in Rs. crores).
The sum of FDI of 1992 and 1993 is
937 063a569f024e8fb08b9fe1729
63a569f024e8fb08b9fe1729 - 1Rs. 15.58 croresfalse
- 2Rs. 15.85 crorestrue
- 3Rs. 15.22 croresfalse
- 4Rs. 15.65 croresfalse
- Show AnswerHide Answer
- Workspace
- SingleChoice
Answer : 2. "Rs. 15.85 crores "
Q:Directions : Study the following graph and answer the questions.
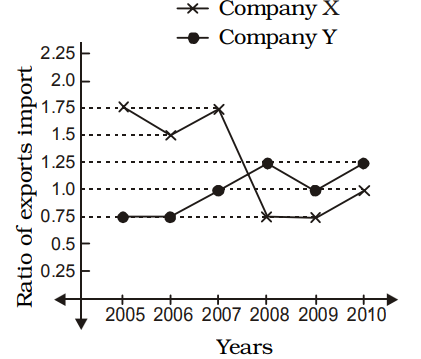
In 2005, the exports of company X were double that of company Y in that year. If the imports of company X during the year were 180 crores, what was the amount (in crore) of imports of company Y during the year?
922 063a5564424e8fb08b9fd64c7
63a5564424e8fb08b9fd64c7 - 1212false
- 2210true
- 3315false
- 4282false
- Show AnswerHide Answer
- Workspace
- SingleChoice