Aptitude Practice Question and Answer
8 Q:Direction: The line chart given below shows the number of labors (men and women) working in six different years. Study the data carefully and answer the following questions.
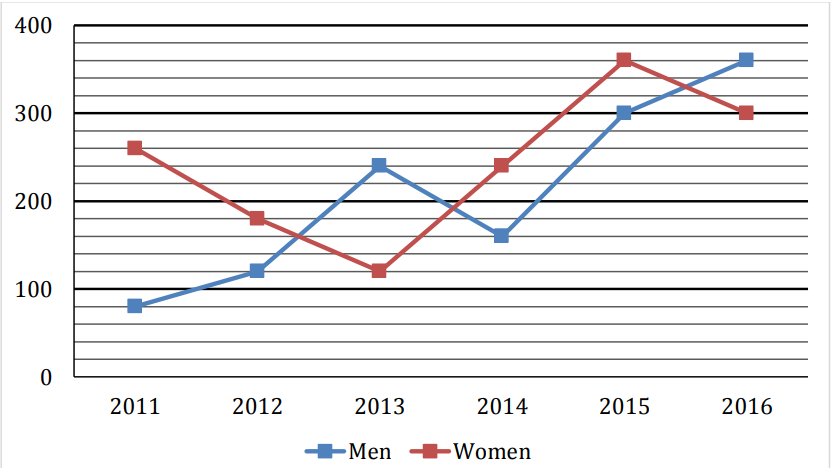
Number of Men working in 2017 is 15% more than that of 2015 while number of Women working in 2017 is 40% less than that of 2014. Find total number of labors (Men + Women) working in 2017?
2687 0603dc76d6f990444b4a3ed31
603dc76d6f990444b4a3ed31- 1594false
- 2630false
- 3561false
- 4456false
- 5489true
- Show AnswerHide Answer
- Workspace
- SingleChoice
Answer : 5. "489 "
Q: The average weight of 29 students is 40 kg. If the weight of teacher be included the average weight increased by 400 gms. The weight of the teacher is-
1861 0603dce2ee759ac364c8ba6f3
603dce2ee759ac364c8ba6f3- 150 kgfalse
- 249 kgfalse
- 352 kgtrue
- 455 kgfalse
- 5None of thesefalse
- Show AnswerHide Answer
- Workspace
- SingleChoice
Answer : 3. "52 kg "
Q: A table is sold at a profit of 20%. If both the cost price and the selling price of the table are decreased by Rs. 100, then new profit percent becomes 25%.Find the original cost price of table.
1501 0603dcdabcd43d04a8f5caaab
603dcdabcd43d04a8f5caaab- 1Rs. 550false
- 2Rs. 650false
- 3Rs. 600false
- 4Cannot be determinedfalse
- 5None of thesetrue
- Show AnswerHide Answer
- Workspace
- SingleChoice
Answer : 5. "None of these "
Q:Direction: The line chart given below shows the number of labors (men and women) working in six different years. Study the data carefully and answer the following questions.
Total number of Men working in all six years is how much more/less than total number of Women working in all six years together?
2136 0603dcbd7ec464f505f27715e
603dcbd7ec464f505f27715e- 1180false
- 2200true
- 3140false
- 4160false
- 5None of the given optionsfalse
- Show AnswerHide Answer
- Workspace
- SingleChoice
Answer : 2. "200"
Q:Direction: The line chart given below shows the number of labors (men and women) working in six different years. Study the data carefully and answer the following questions.
Find the ratio between total number of Labors working in 2012 and 2013 together to total number of labors working in 2015 and 2016 together?
2160 0603dcb36e759ac364c8ba37b
603dcb36e759ac364c8ba37b- 135 : 66false
- 211 : 10false
- 32 : 1false
- 41 : 2true
- 5None of the given optionsfalse
- Show AnswerHide Answer
- Workspace
- SingleChoice
Answer : 4. "1 : 2 "
Q:Direction: The line chart given below shows the number of labors (men and women) working in six different years. Study the data carefully and answer the following questions.
Total number of Men working in 2012 and 2013 together is what percent of the total number of labors (Men + Women) working in 2014?
3300 0603dc62fcd43d04a8f5c9fc0
603dc62fcd43d04a8f5c9fc0- 190%true
- 240%false
- 360%false
- 470%false
- 580%false
- Show AnswerHide Answer
- Workspace
- SingleChoice
Answer : 1. "90% "
Q:Direction: The line chart given below shows the number of labors (men and women) working in six different years. Study the data carefully and answer the following questions.
Average number of Women working in 2014, 2015 and 2016 together is how much more/less than average number of Men working in 2011, 2014 and 2016 together?
3591 0603dc6d5e759ac364c8b9e0d
603dc6d5e759ac364c8b9e0d- 190false
- 270false
- 3100true
- 480false
- 5None of the given optionsfalse
- Show AnswerHide Answer
- Workspace
- SingleChoice
Answer : 3. "100 "
Q: The difference between CI and SI on a sum of money for 3 years at 5% per annum is Rs.61. Find the sum.
1575 060377047cd43d04a8f4b81d8
60377047cd43d04a8f4b81d8- 1₹ 6000false
- 2₹ 8000true
- 3₹ 4000false
- 4₹ 4680false
- Show AnswerHide Answer
- Workspace
- SingleChoice