Aptitude Practice Question and Answer
8 Q:Directions :- Refer the graph and answer the given questions.
The following line graph shows the number of products sold by company A and B during six years.
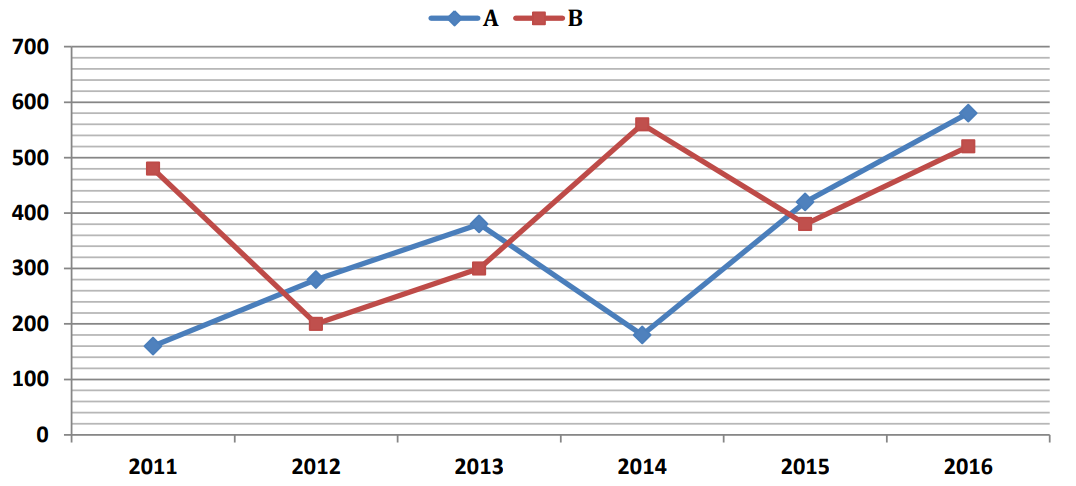
What is the ratio of the total number of products sold by A and B together in 2012 to the total number of products sold in these two companies together in 2015 ?
1326 05fd32c9ac46a213fc5c46b19
5fd32c9ac46a213fc5c46b19The following line graph shows the number of products sold by company A and B during six years.
- 112 : 25false
- 23 : 5true
- 34 : 3false
- 45 : 3false
- 5None of thesefalse
- Show AnswerHide Answer
- Workspace
- SingleChoice
Answer : 2. "3 : 5"
Q: Find the value of $$ {(0.75)^3\over1-.75}+[0.75+(0.75)^2+1]$$
1326 05eeb706e3716d10a7a4a2463
5eeb706e3716d10a7a4a2463- 12false
- 21false
- 34true
- 43false
- Show AnswerHide Answer
- Workspace
- SingleChoice
Answer : 3. "4"
Q: If Diagonal of rectangle is 41 cm and one side of Rectangle is 9 cm Then find out Ratio of perimeter and area of Rectangle?
1325 05e8afcaacbf02e5d987268d1
5e8afcaacbf02e5d987268d1- 149 : 180true
- 249 : 190false
- 3180 : 49false
- 418 : 149false
- Show AnswerHide Answer
- Workspace
- SingleChoice
Answer : 1. "49 : 180"
Q:Direction : What value should come in place question mark(?) in the following questions?
0.75 % of 90 + 0.55 % of 80=?
1325 05e9d15dadc1ff94610d1b56c
5e9d15dadc1ff94610d1b56c- 11.725false
- 21.475false
- 31.325false
- 41.115true
- 50.995false
- Show AnswerHide Answer
- Workspace
- SingleChoice
Answer : 4. "1.115"
Q: The average of four consecutive odd numbers is 36. What is the smallest of these numbers?
1325 061962af9a18e735d86cdf763
61962af9a18e735d86cdf763- 131false
- 235false
- 343false
- 447false
- 5None of thesetrue
- Show AnswerHide Answer
- Workspace
- SingleChoice
Answer : 5. "None of these "
Q: $$ (17)^{2} + 6 × (13)^{2}-212×6$$
1325 062c3ea29a00ee61c312bf0db
62c3ea29a00ee61c312bf0db- 111false
- 223false
- 349false
- 431true
- 547false
- Show AnswerHide Answer
- Workspace
- SingleChoice
Answer : 4. "31"
Q:Study the following table and answer the equation:
Number of cars sold by dealers A, B, C, D and E during first six
months of 2018.
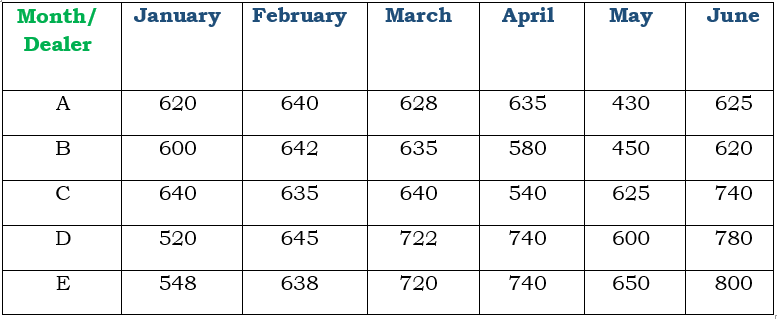
The ratio of the total number of cars sold by dealer B in January, April and June to the total number of cars sold by dealers A and D in March is:
1325 0619e08c6925df30febf07d0e
619e08c6925df30febf07d0eNumber of cars sold by dealers A, B, C, D and E during first six months of 2018.
- 18:9false
- 27:5false
- 34:3true
- 410:9false
- Show AnswerHide Answer
- Workspace
- SingleChoice
Answer : 3. "4:3 "
Q: 1-[5-{2+(-5+6-2)2}] is equal to
1325 05eeb6eca13d72d584fb5a485
5eeb6eca13d72d584fb5a485- 12true
- 20false
- 3- 4false
- 4-2false
- Show AnswerHide Answer
- Workspace
- SingleChoice