Aptitude Practice Question and Answer
8 Q: Train A takes 1 hour more than train B to travel a distance of 720 km. Due to engine trouble speed of train B falls by one third, so it takes 3 hours more than Train A to complete the same journey. What is the speed of Train A (in km/hr)?
1185 062fb4495d30c675eef59ef9f
62fb4495d30c675eef59ef9f- 160false
- 290false
- 360false
- 480true
- Show AnswerHide Answer
- Workspace
- SingleChoice
Answer : 4. "80"
Q:Directions: The bar graph given below shows the production (in ' 000 tones) of rice of a country for the year 2007 to 2011. Study the graph carefully and answer the question given below it.
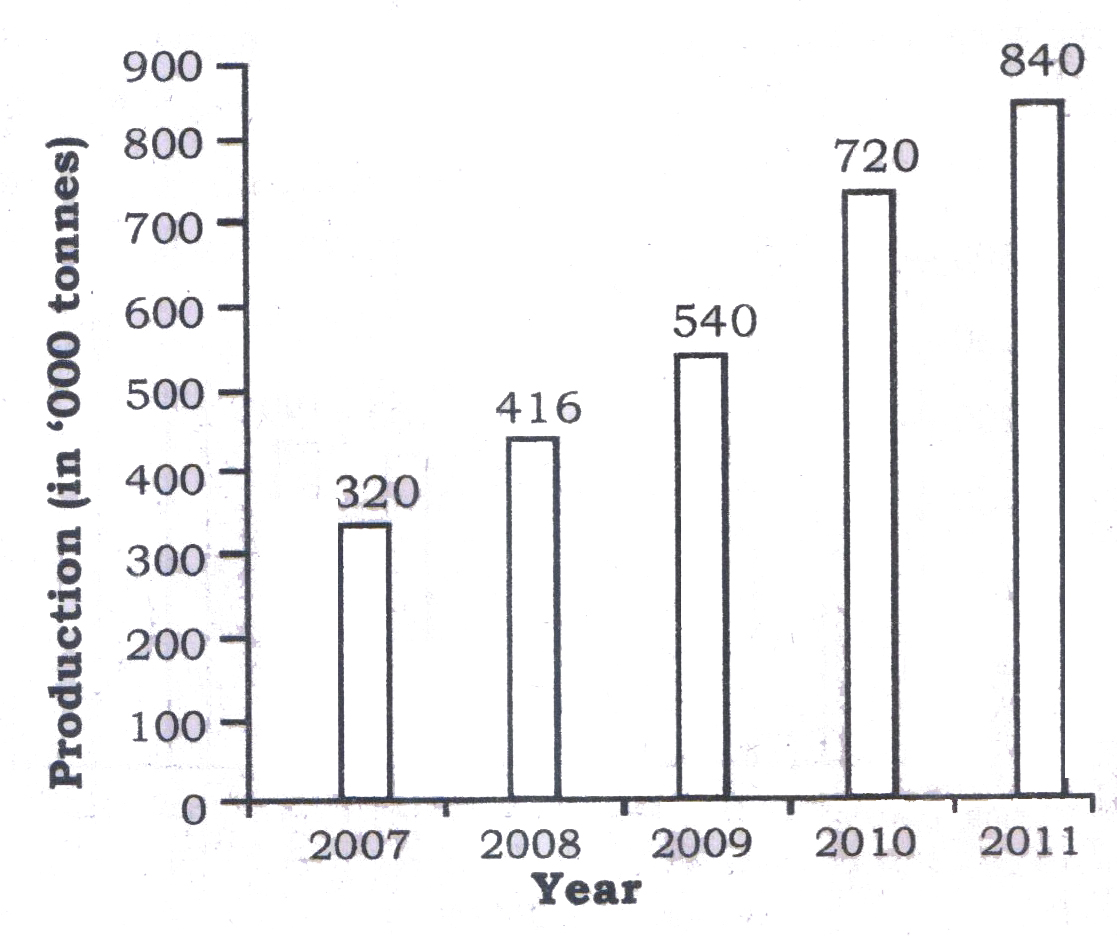
What is the average production of rice per year from 2009 to 2011? (in thousand tones)
1185 05e81867ad56d695255db5622
5e81867ad56d695255db5622- 1700true
- 2550false
- 3860false
- 4900false
- Show AnswerHide Answer
- Workspace
- SingleChoice
Answer : 1. "700 "
Q: The diameter of a circle is equal to the perimeter of a square whose area is 3136 sq cm. What is the circumference of the circle?
1185 063d0db186071cf76fc19e94e
63d0db186071cf76fc19e94e- 1352 cmfalse
- 2704 cmtrue
- 3394 cmfalse
- 4None of thesefalse
- Show AnswerHide Answer
- Workspace
- SingleChoice
Answer : 2. "704 cm"
Q: A man cover a certain distance in 3 hours 36 minute if he walks at the rate of 5 km/hr. If he covers the same distance on cycle at the rate of 24 km/hr, then the time taken by him in minute is__
1185 05f0680d27adfe107cffc0ed9
5f0680d27adfe107cffc0ed9- 140false
- 245true
- 350false
- 455false
- Show AnswerHide Answer
- Workspace
- SingleChoice
Answer : 2. "45"
Q: The ratio of the monthly incomes of A and B is 11 : 13 and the ratio of their expenditures is 9 : 11. If both of them manage to save ₹4,000 per month, then find the difference in their incomes (in ₹).
1185 0646dd60883ab324a7067fa3a
646dd60883ab324a7067fa3a- 12,500false
- 24,000true
- 33,200false
- 43,000false
- Show AnswerHide Answer
- Workspace
- SingleChoice
Answer : 2. "4,000"
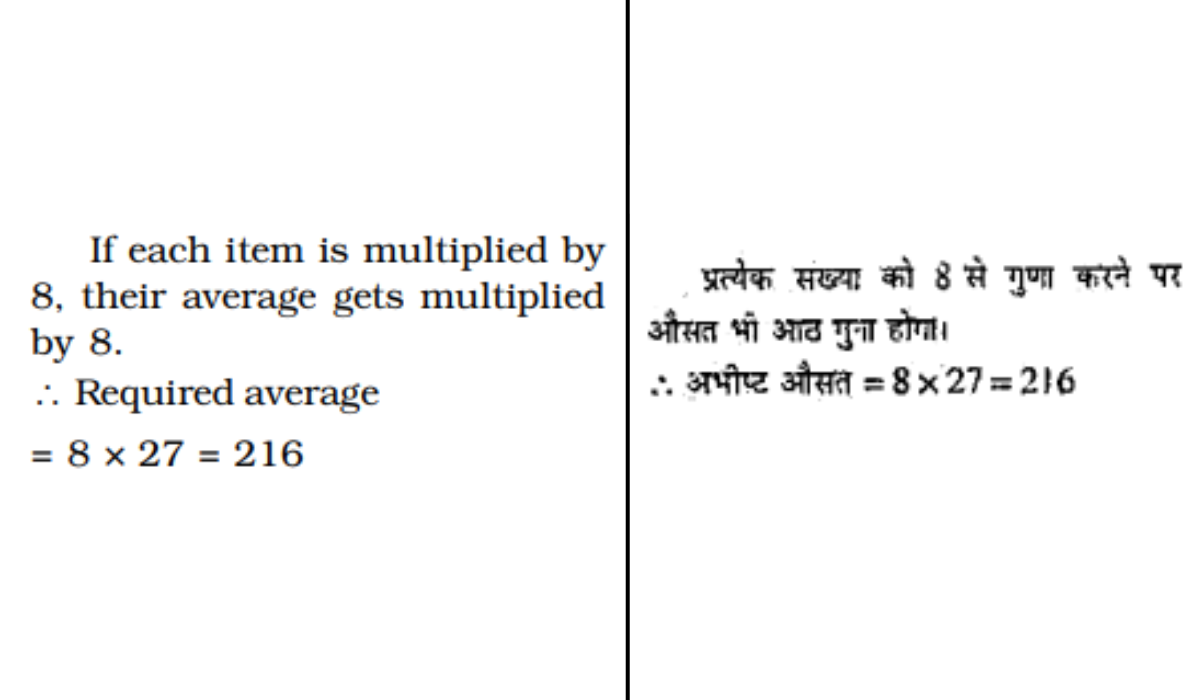
Q: The average of 8 numbers is 27. If each of the numbers is multiplied by 8, find the average of new set of numbers.
1184 062ff8060a6d1894ab156cd88
62ff8060a6d1894ab156cd88- 11128false
- 2938false
- 3316false
- 4216true
- Show AnswerHide Answer
- Workspace
- SingleChoice
Answer : 4. "216"
Explanation :
Q: The average score of top 6 batsmen of Indian cricket team in a match is 46. If the 7th batsman is included, the average becomes 50. If the 8 batsman comes and scores 34 runs, then find the ratio of the average scores of top 6 and top 8 batsmen.
1184 064e740bfde1aa1b70fdea8f0
64e740bfde1aa1b70fdea8f0- 111:12false
- 220:17false
- 323:24true
- 45:7false
- 518:11false
- Show AnswerHide Answer
- Workspace
- SingleChoice
Answer : 3. "23:24"
Q: Alloy A contains metals x and y only in the ratio 5: 2 and alloy B contains these metals in the ratio 3: 4. Alloy C is prepared by mixing A and B in the ratio 4: 5. The percentage of x in alloy C is:
1184 064c76a993fde307e3f4acc19
64c76a993fde307e3f4acc19- 145false
- 2$$55{5\over 9}$$true
- 3$$44{4\over 9}$$false
- 456false
- Show AnswerHide Answer
- Workspace
- SingleChoice