Aptitude Practice Question and Answer
8 Q:Direction : Each of the questions below consists of a question and three statements numbered I, II and III given below it. You have to decide whether the data provided in the statements are sufficient to answer the question.
What will the area of a regular pentagon?
I. The length of each side is 12 cm.
II. The measure of each angle is 108 degrees.
1414 05ea8f936a63dac4c26cdeb28
5ea8f936a63dac4c26cdeb28I. The length of each side is 12 cm.
II. The measure of each angle is 108 degrees.
- 1The data in statement I alone is sufficient to answer the question, while the data in statement II alone is not sufficient to answer the question.true
- 2The data in statement II alone is sufficient to answer the question, while the data in statement I alone is not sufficient to answer the question.false
- 3The data in statement I alone or in statement II alone is sufficient to answer the question.false
- 4The data in both the statements I and II is not sufficient to answer the question.false
- 5The data in both the statements I and II together is necessary to answer the question.false
- Show AnswerHide Answer
- Workspace
- SingleChoice
Answer : 1. "The data in statement I alone is sufficient to answer the question, while the data in statement II alone is not sufficient to answer the question."
Q: Everybody in a room shakes hands with everybody else. The total number of hand-shakes is 55. The total number of persons in the room is:
2079 05ea8f8583dbbdc761959abde
5ea8f8583dbbdc761959abde- 111true
- 212false
- 38false
- 414false
- 5None of thesefalse
- Show AnswerHide Answer
- Workspace
- SingleChoice
Answer : 1. "11"
Q: There are four different bags. Also, there are four different coins. In how many ways can the coins be put into bags if there are exactly two coins in exactly one of the bags?
10280 05ea8f6eba63dac4c26cdea21
5ea8f6eba63dac4c26cdea21- 148false
- 296false
- 372false
- 4144true
- 5180false
- Show AnswerHide Answer
- Workspace
- SingleChoice
Answer : 4. "144"
Q: A and B started a business with investments Rs 3500 and Rs 2500 respectively. After 4 months C joined with Rs 6000. If the difference between C's share and B's share in the annual profit was Rs 1977, what was the total annual profit?
3514 05ea6d7c65657c22f7803d964
5ea6d7c65657c22f7803d964- 1Rs 15620false
- 2Rs 16240false
- 3Rs 14690false
- 4Rs 12770false
- 5Rs 13180true
- Show AnswerHide Answer
- Workspace
- SingleChoice
Answer : 5. "Rs 13180 "
Q:Directions: The bar graph, given here, shows the number of tickets sold by 6 students A, B, C, D, E and F during a fair.
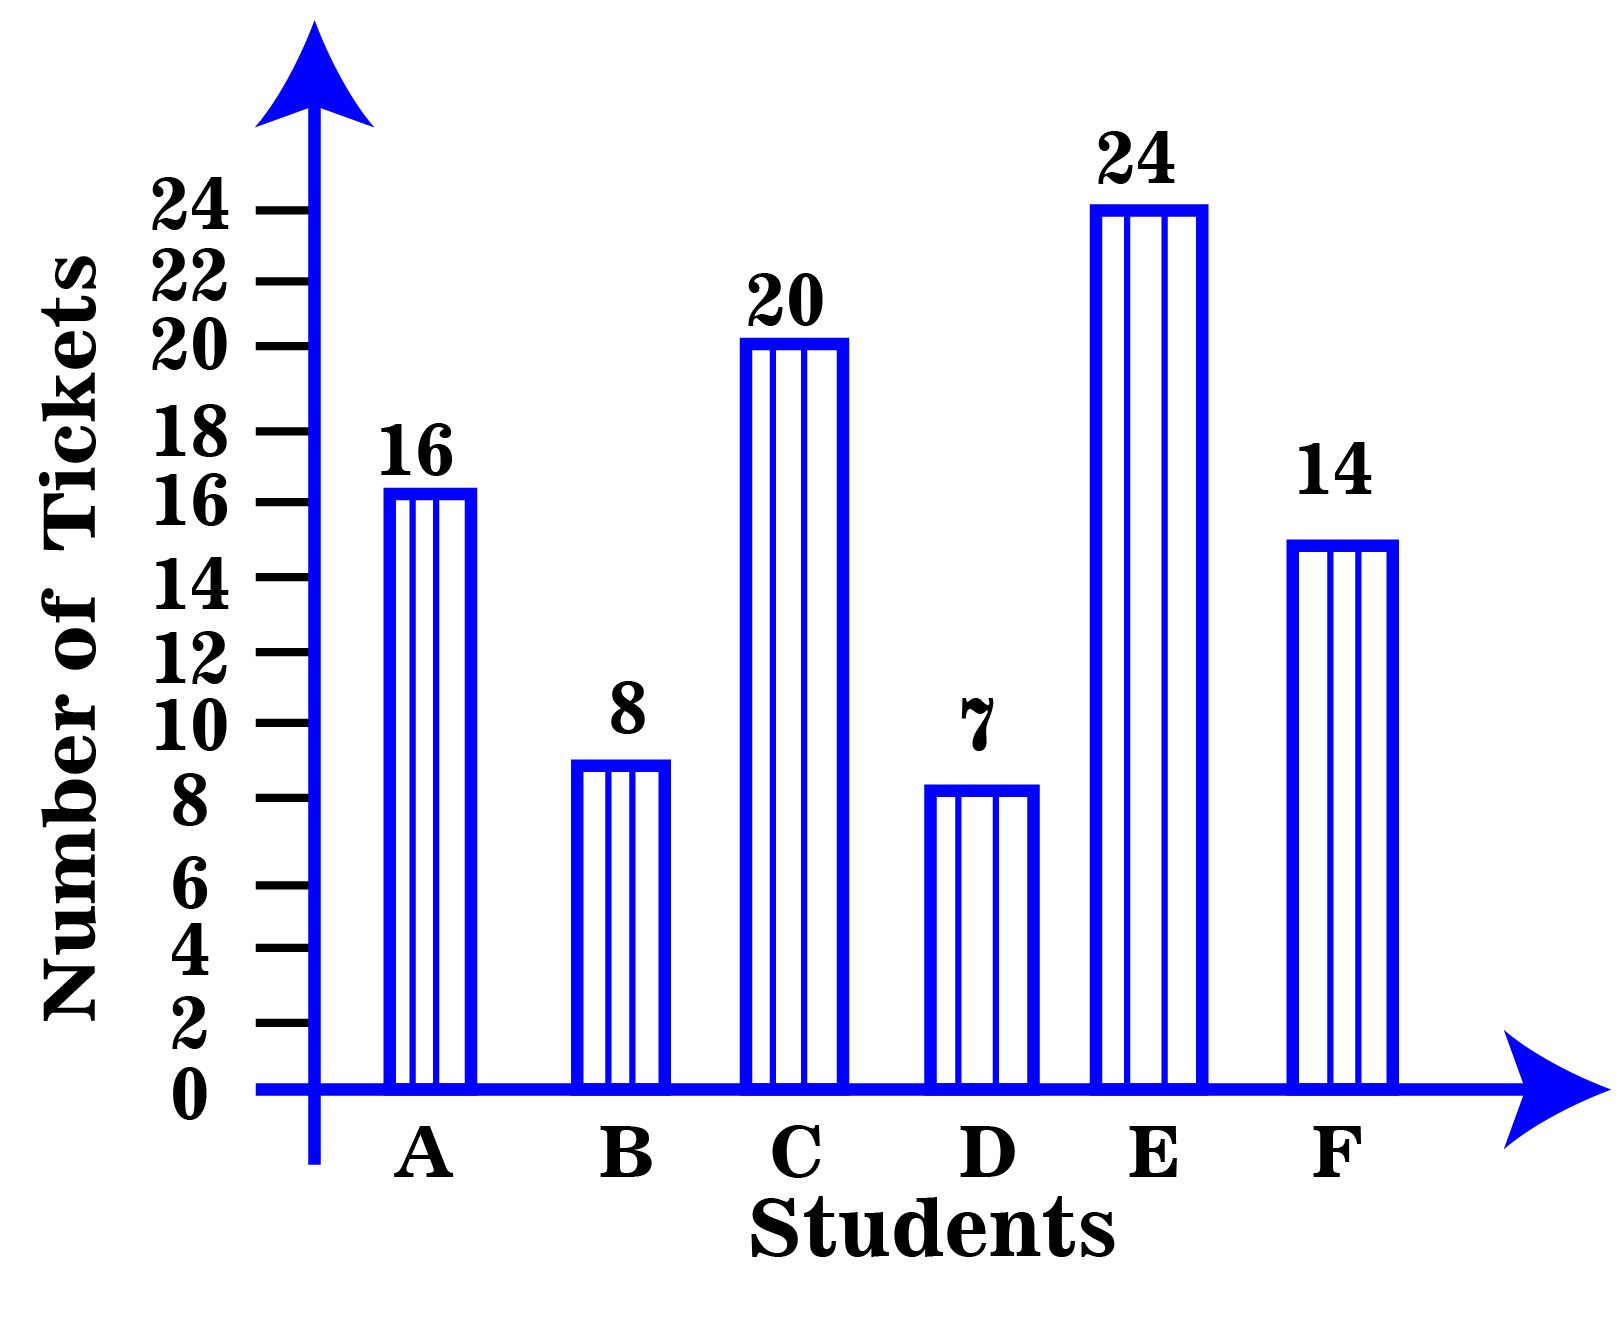
Total number of tickets sold by A, B and C is
2454 05ea81363a63dac4c26cbd00d
5ea81363a63dac4c26cbd00d- 145false
- 244true
- 342false
- 440false
- 5None of thesefalse
- Show AnswerHide Answer
- Workspace
- SingleChoice
Answer : 2. "44 "
Q:Directions: The Bar Graph given here shows the population (in crores) of India in various census years. Observe the graph and answer the question based on it.
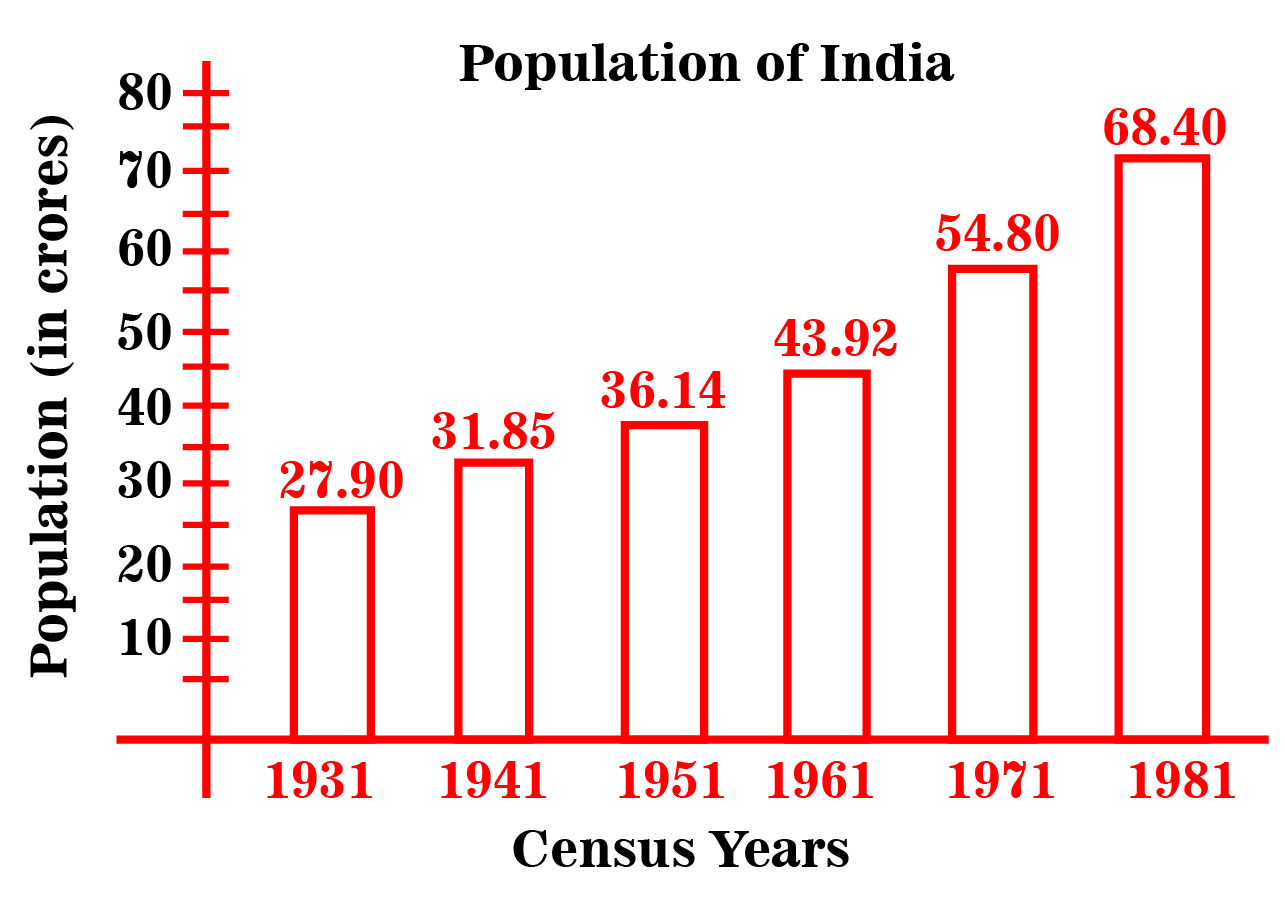
In which census year, the percent increase in population is highest as compared to that in the previous census year?
1814 05ea8113ca63dac4c26cb72b8
5ea8113ca63dac4c26cb72b8- 11951false
- 21961false
- 31971false
- 41981true
- 5None of thesefalse
- Show AnswerHide Answer
- Workspace
- SingleChoice
Answer : 4. "1981"
Q:Directions: The Bar Graph given here shows the population (in crores) of India in various census years. Observe the graph and answer the question based on it.
In which census year, the percent increase in population is least as compared to that in the previous census year?
1747 05ea811ae3b50714be9b1d5c9
5ea811ae3b50714be9b1d5c9- 11961false
- 21951true
- 31971false
- 41941false
- 5None of thesefalse
- Show AnswerHide Answer
- Workspace
- SingleChoice
Answer : 2. "1951 "
Q:Directions: The Bar Graph given here shows the population (in crores) of India in various census years. Observe the graph and answer the question based on it.
Per year increase in population from the year 1931 to 1981 is
3148 05ea8124ec8dec64c00978d98
5ea8124ec8dec64c00978d98- 18100000true
- 27600000false
- 38900000false
- 46700000false
- 5None of thesefalse
- Show AnswerHide Answer
- Workspace
- SingleChoice