Aptitude Practice Question and Answer
8 Q: Cost of 36 pens and 42 Pencils is Rs 460. What is the cost of 18 pens and 21 pencils?
2046 05df0b8600183ea49d62ac237
5df0b8600183ea49d62ac237- 1230true
- 2203false
- 3302false
- 4320false
- 5None of thesefalse
- Show AnswerHide Answer
- Workspace
- SingleChoice
Answer : 1. "230"
Explanation :
(36 Pens + 42 Pencils)=460
2(18Pens + 21 Pencils) = 460
18 Pens +21 Pencils =230 Ans.
Q: If the graph of the equations x + y = 0 and 5y + 7x =24 intersect at (m, n), then the value of m + n is :
2167 05df1fe49004abe5c78f985c0
5df1fe49004abe5c78f985c0- 12false
- 21false
- 30true
- 4– 1false
- Show AnswerHide Answer
- Workspace
- SingleChoice
Answer : 3. "0"
Q: If cos2α + cos2β = 2, then the value of tan3 α + sin5 β is :
3270 05df1f6610183ea49d62ce47e
5df1f6610183ea49d62ce47e- 1– 1false
- 20true
- 31false
- 4$$ {1\over √3 } $$false
- Show AnswerHide Answer
- Workspace
- SingleChoice
Answer : 2. "0"
Q: Simple Interest received by a person in 10 years on a principal. of the Rs. 9500 is 130% of the principal. What is the rate of interest (in %) per annum?
2176 05df1f57dfb64ec452cb5ef9f
5df1f57dfb64ec452cb5ef9f- 112false
- 213true
- 315false
- 419false
- Show AnswerHide Answer
- Workspace
- SingleChoice
Answer : 2. "13 "
Q:Direction: Study the following graph carefully and answer the questions that follow:
The graph given below represents the number of users of two broadband services A and B across 5 cities P, Q, R, S and T.
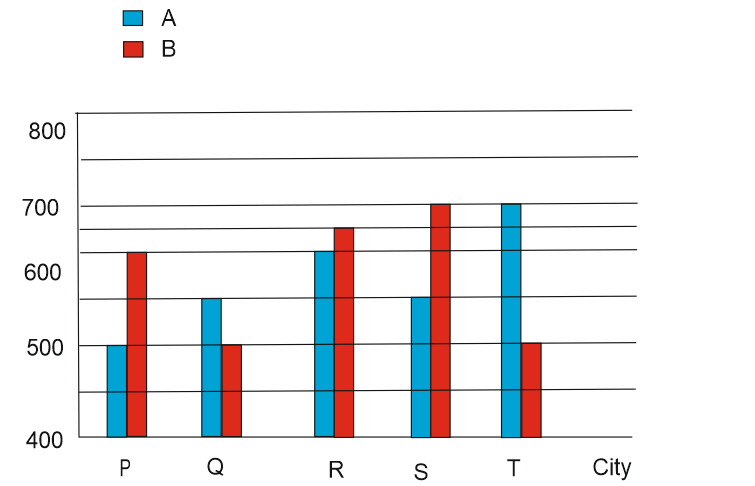
What is the respective ratio of the number of users of brand A in city P to the number of users of brand B in the City S?
1855 05df0be0ee837331209ea1ec0
5df0be0ee837331209ea1ec0The graph given below represents the number of users of two broadband services A and B across 5 cities P, Q, R, S and T.
- 15:7true
- 24:7false
- 32:5false
- 43:4false
- 55:6false
- Show AnswerHide Answer
- Workspace
- SingleChoice
Answer : 1. "5:7"
Q:Direction: Study the following graph carefully and answer the questions that follow:
The graph given below represents the number of users of two broadband services A and B across 5 cities P, Q, R, S and T.
What is the difference between the total number of users of brand A and B together in City R and the total number of users of brand A and B together in City P?
1654 05df0bda2e837331209ea1b4f
5df0bda2e837331209ea1b4fThe graph given below represents the number of users of two broadband services A and B across 5 cities P, Q, R, S and T.
- 1170false
- 2140false
- 3130false
- 4150true
- 5160false
- Show AnswerHide Answer
- Workspace
- SingleChoice
Answer : 4. "150"
Q:Direction: Study the following graph carefully and answer the questions that follow:
The graph given below represents the number of users of two broadband services A and B across 5 cities P, Q, R, S and T.
What is the average number of users of brand A across all five cities together?
1498 05df0bcc53d76f974e561f6f3
5df0bcc53d76f974e561f6f3The graph given below represents the number of users of two broadband services A and B across 5 cities P, Q, R, S and T.
- 1560false
- 2570false
- 3580true
- 4590false
- 5550false
- Show AnswerHide Answer
- Workspace
- SingleChoice
Answer : 3. "580"
Q:Direction: Study the following graph carefully and answer the questions that follow:
The graph given below represents the number of users of two broadband services A and B across 5 cities P, Q, R, S and T.
The number of users of brand A in city T is what percent of the number of users of brand B in city Q?
1535 05df0bc51e837331209ea1929
5df0bc51e837331209ea1929The graph given below represents the number of users of two broadband services A and B across 5 cities P, Q, R, S and T.
- 1150false
- 2110false
- 3140true
- 4160false
- 5120false
- Show AnswerHide Answer
- Workspace
- SingleChoice