Aptitude Practice Question and Answer
8 Q:Directions : Read the graph and answer the following questions.
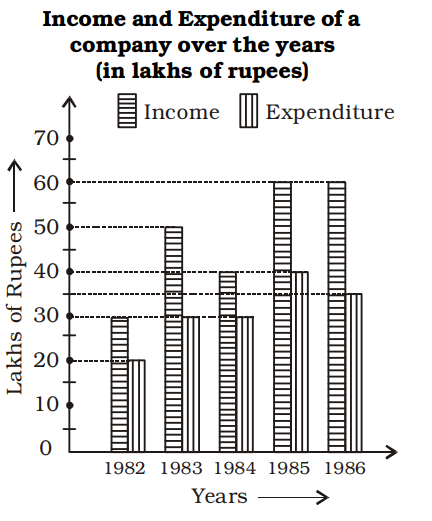
What is the difference in profit between 1983 and 1984 (in lakhs of rupees) ?
872 06461024745f1450a80c4103d
6461024745f1450a80c4103d- 1No profitfalse
- 25false
- 310true
- 415false
- Show AnswerHide Answer
- Workspace
- SingleChoice
Answer : 3. "10 "
Q: In a circle with centre O, a diameter AB is produced to a point P lying outside the circle and PT is a tangent to the circle at the point C on it. If ∠BPT = 36°, then what is the measure of ∠BCP?
872 064b9165ce2108a723934f7bb
64b9165ce2108a723934f7bb- 1240false
- 2180true
- 3360false
- 4270true
- Show AnswerHide Answer
- Workspace
- SingleChoice
Answer : 2. "180" 4. "270"
Q: Acid and water are mixed in a vessel A in the ratio of 5:2 and in vessel B in the ratio 8:5. In what proportion should quantities be taken out from the two vessels so as to form a new mixture in which the acid and water will be in the ratio of 9:4?
871 064105fdc539cee0fcaba44d6
64105fdc539cee0fcaba44d6- 17:2true
- 27:4false
- 32:7false
- 42:3false
- Show AnswerHide Answer
- Workspace
- SingleChoice
Answer : 1. "7:2"
Q: ABCD is a cycle quadrilateral and BC is diameter of the related circle on which A and D also lie. ∠BCA =190 and ∠CAD=320. What is the measure of ∠ACD?
870 064ad31aff583a8c59d566125
64ad31aff583a8c59d566125- 1false
410
- 2false
380
- 3false
400
- 4true
390
- Show AnswerHide Answer
- Workspace
- SingleChoice
Answer : 4. "390
"
Q:Directions: The sub divided bar diagram given below depicts Higher secondary Students of a school for three years. Study the diagram and answer the questions

The percentage passed in 1st division in 2008 was
869 0645ce5b945f1450a80b9e89d
645ce5b945f1450a80b9e89d- 127%false
- 232%false
- 3$$15{3\over 8}\% $$false
- 4$$11{13\over 17}\% $$true
- Show AnswerHide Answer
- Workspace
- SingleChoice
Answer : 4. " $$11{13\over 17}\% $$"
Q:Directions: The sub divided bar diagram given below depicts Higher secondary Students of a school for three years. Study the diagram and answer the questions
In which year the school had the best result for Higher Secondary in respect of percentage of pass candidates?
869 0645ce7c7f75f230a7a679ad4
645ce7c7f75f230a7a679ad4- 12008true
- 22009false
- 32010false
- 4The percentage of pass candidates are same for the three years.false
- Show AnswerHide Answer
- Workspace
- SingleChoice
Answer : 1. "2008 "
Q:Directions : Study the following frequency polygon and answer the questions. Given a line graph showing the number of students passed in Higher Secondary Examination in a school over the years 2008 to 2013.

The average of passed students in the years 2008, 2009, 2012 approximately is
868 0639321109dda13791d752daf
639321109dda13791d752daf- 1134.32false
- 2134.41false
- 3134.56false
- 4134.67true
- Show AnswerHide Answer
- Workspace
- SingleChoice
Answer : 4. "134.67"
Q: If the speed of a boat in still water is 20 km/hr and the speed of the current is 5km / hr, then the time taken by the boat to travel 100km with the current is
868 0640839783218fd8d147b6397
640839783218fd8d147b6397- 12 hrfalse
- 23 hrfalse
- 34 hrtrue
- 47 hrfalse
- Show AnswerHide Answer
- Workspace
- SingleChoice