Aptitude Practice Question and Answer
8 Q:Directions : The bar graph, given here, shows the demand and production of colour televisions of five companies for Diwali season in the year 2009. Study the graph carefully and answer the questions based on the graph.
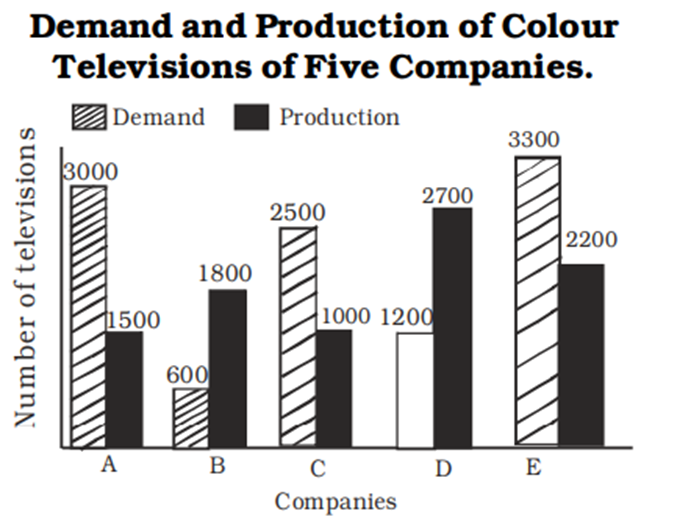
The ratio of companies having more demand than production of colour televisions to those having more production than demand is :
831 06461004c4f2cce984334e61f
6461004c4f2cce984334e61f- 12 : 3false
- 24 : 1false
- 31 :4false
- 43 : 2true
- Show AnswerHide Answer
- Workspace
- SingleChoice
Answer : 4. "3 : 2"
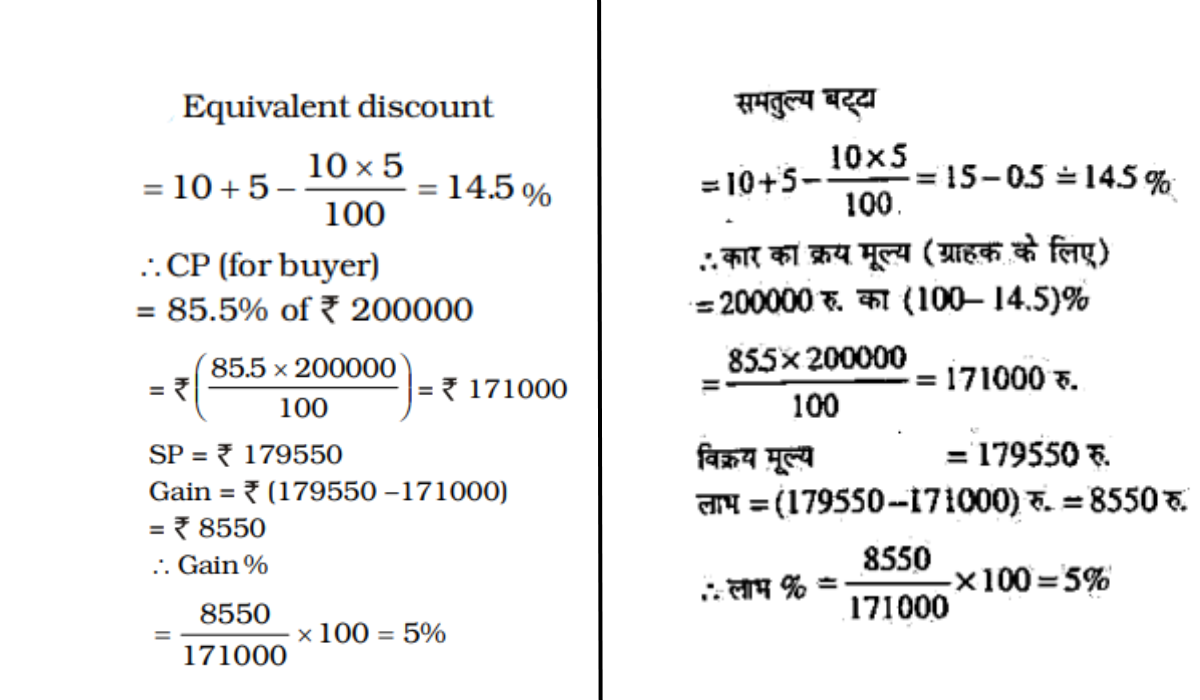
Q: A dealer buys a car listed at 200000 at successive discounts of 5% and 10%. If he sells the car for 179550, then his profit is
831 0624d5739e6c50b4b29d6ef60
624d5739e6c50b4b29d6ef60- 15%true
- 24%false
- 310%false
- 49%false
- Show AnswerHide Answer
- Workspace
- SingleChoice
Answer : 1. "5% "
Explanation :
Q: The measure of an angle whose supplement is three times as large as its complement, is
830 06464a968c899b466f45025f5
6464a968c899b466f45025f5- 175°false
- 230°false
- 345°true
- 460°false
- Show AnswerHide Answer
- Workspace
- SingleChoice
Answer : 3. "45° "
Q: If (3x – 2y) : (2x + 3y) = 5 : 6, then one of the values of $${\left({^3\sqrt { x}+\ ^3\sqrt { y}\over ^3\sqrt { x}-\ ^3\sqrt { y} } \right) \ }^2$$ is
830 064660c7ff75f230a7a80d203
64660c7ff75f230a7a80d203- 1$$1\over 5$$false
- 25false
- 3$$1\over 25$$false
- 425true
- Show AnswerHide Answer
- Workspace
- SingleChoice
Answer : 4. "25"
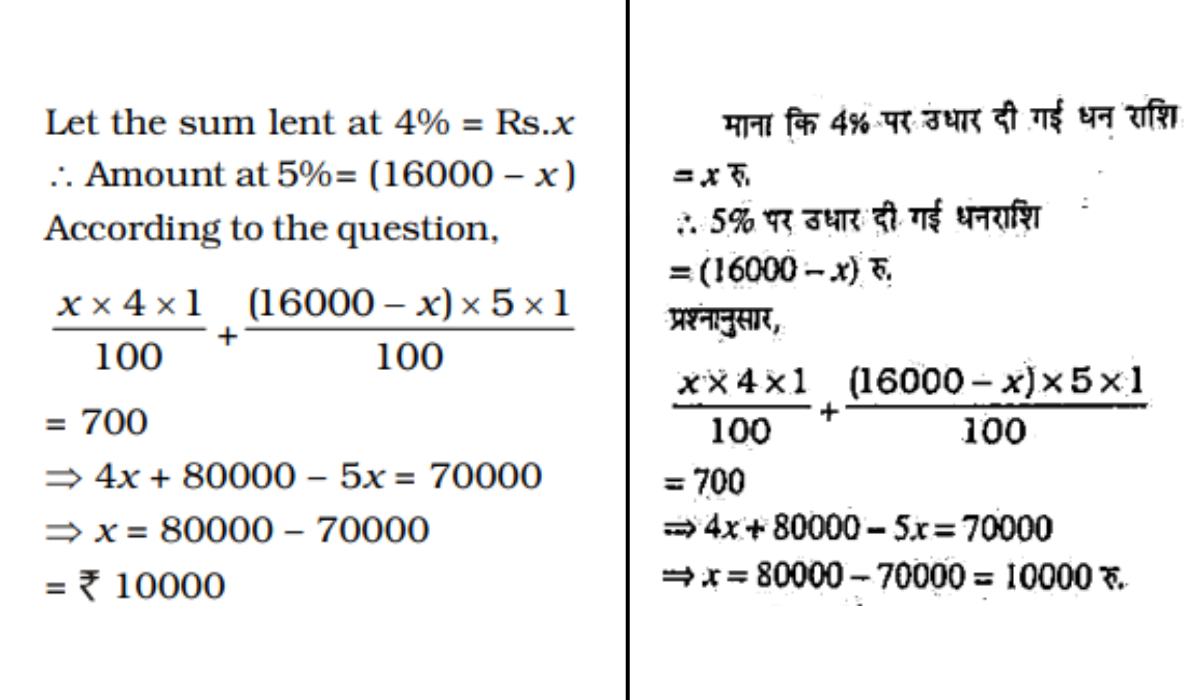
Q: A man had ₹ 16,000, part of which he lent at 4% and the rest at 5% per annum simple interest. If the total interest received was 700 in one year, the money lent at 4% per annum was
830 065423e4ef7eb27e554afc282
65423e4ef7eb27e554afc282- 1₹12,000false
- 2₹ 8,000false
- 3₹ 10,000true
- 4₹ 6,000false
- Show AnswerHide Answer
- Workspace
- SingleChoice
Answer : 3. "₹ 10,000 "
Explanation :
Q:Directions: Study the following information carefully and answer the questions given below.
In the table, the percentage of shirts (formal and casual) sold out of the total number of shirts sold in the week and the number of casual shirts sold data related to the number of shirts sold on ve weekdays – Monday, Tuesday, Wednesday, Thursday and Friday are given.
Total number of shirts sold in the week = x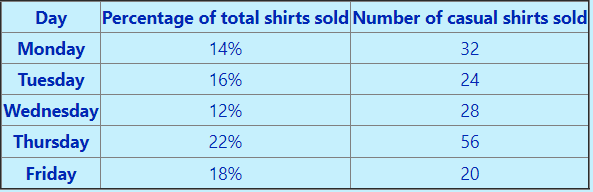 Note: Total number of shirts sold on Saturday and Sunday together = 72
40% of casual shirts sold and 25% of formal shirts sold on Friday of brand X, then the number of shirts sold of brands other than X on Friday is
830 064e5ef003be218b6cdc29ab1
64e5ef003be218b6cdc29ab1In the table, the percentage of shirts (formal and casual) sold out of the total number of shirts sold in the week and the number of casual shirts sold data related to the number of shirts sold on ve weekdays – Monday, Tuesday, Wednesday, Thursday and Friday are given.
Note: Total number of shirts sold on Saturday and Sunday together = 72- 121false
- 231false
- 341false
- 451true
- 5None of thesefalse
- Show AnswerHide Answer
- Workspace
- SingleChoice
Answer : 4. "51"
Q:Directions : A bar graph showing the heights of six mountain peaks is given below. Study the bar graph and answer the questions.

Which peak is the second highest ?
829 063930c38d319b37ca19af109
63930c38d319b37ca19af109- 1Bfalse
- 2Ctrue
- 3Afalse
- 4Efalse
- Show AnswerHide Answer
- Workspace
- SingleChoice
Answer : 2. "C "
Q: If a + b – c = 0 then the value of 2b2c2 + 2c2a2 + 2a2b2 –a4 – b4 – c4
829 064660b23cdae930acb8405d5
64660b23cdae930acb8405d5- 17false
- 20true
- 314false
- 428false
- Show AnswerHide Answer
- Workspace
- SingleChoice