Aptitude Practice Question and Answer
8 Q:What should come in place of the question mark '?' in the following number series?
7, 13, ?, 49, 97, 193
786 064dc80069b618cf631e91d71
64dc80069b618cf631e91d71- 127false
- 223false
- 325true
- 429false
- 534false
- Show AnswerHide Answer
- Workspace
- SingleChoice
Answer : 3. "25"
Q: While selling a watch, a shop- keeper gives a discount of 5%. If he gives a discount of 7%, he earns ₹15 less as profit. The marked price of the watch is
784 06400bac9a9f6c7de51a26e46
6400bac9a9f6c7de51a26e46- 1₹ 697.5false
- 2₹ 712.5false
- 3₹ 750true
- 4None of thesefalse
- Show AnswerHide Answer
- Workspace
- SingleChoice
Answer : 3. "₹ 750 "
Q: If x = – 1, then the value of $$ {1\over x^{99}}+{1\over x^{98}}+{1\over x^{97}}+{1\over x^{96}}+{1\over x^{95}}+{1\over x^{94}}+x $$ is
784 06409cdffdf653d9ac22bc8b7
6409cdffdf653d9ac22bc8b7- 11false
- 20false
- 3–2true
- 4–1false
- Show AnswerHide Answer
- Workspace
- SingleChoice
Answer : 3. "–2 "
Q: In the given question, two equations numbered l and II are given. You have to solve both the equations and mark the appropriate answer.
I. 16x2– 32x + 15 = 0
II. 16y2– 48y + 35 = 0
784 064d9f93280ef1e74b4e61691
64d9f93280ef1e74b4e61691- 1x > yfalse
- 2x < yfalse
- 3x ≥ yfalse
- 4x ≤ ytrue
- 5x = y or no relationship could be establishedfalse
- Show AnswerHide Answer
- Workspace
- SingleChoice
Answer : 4. "x ≤ y"
Q:Directions: The following pie chart show proportion of population of seven villages in 2009. Stud the pie chart and answer question that follows:
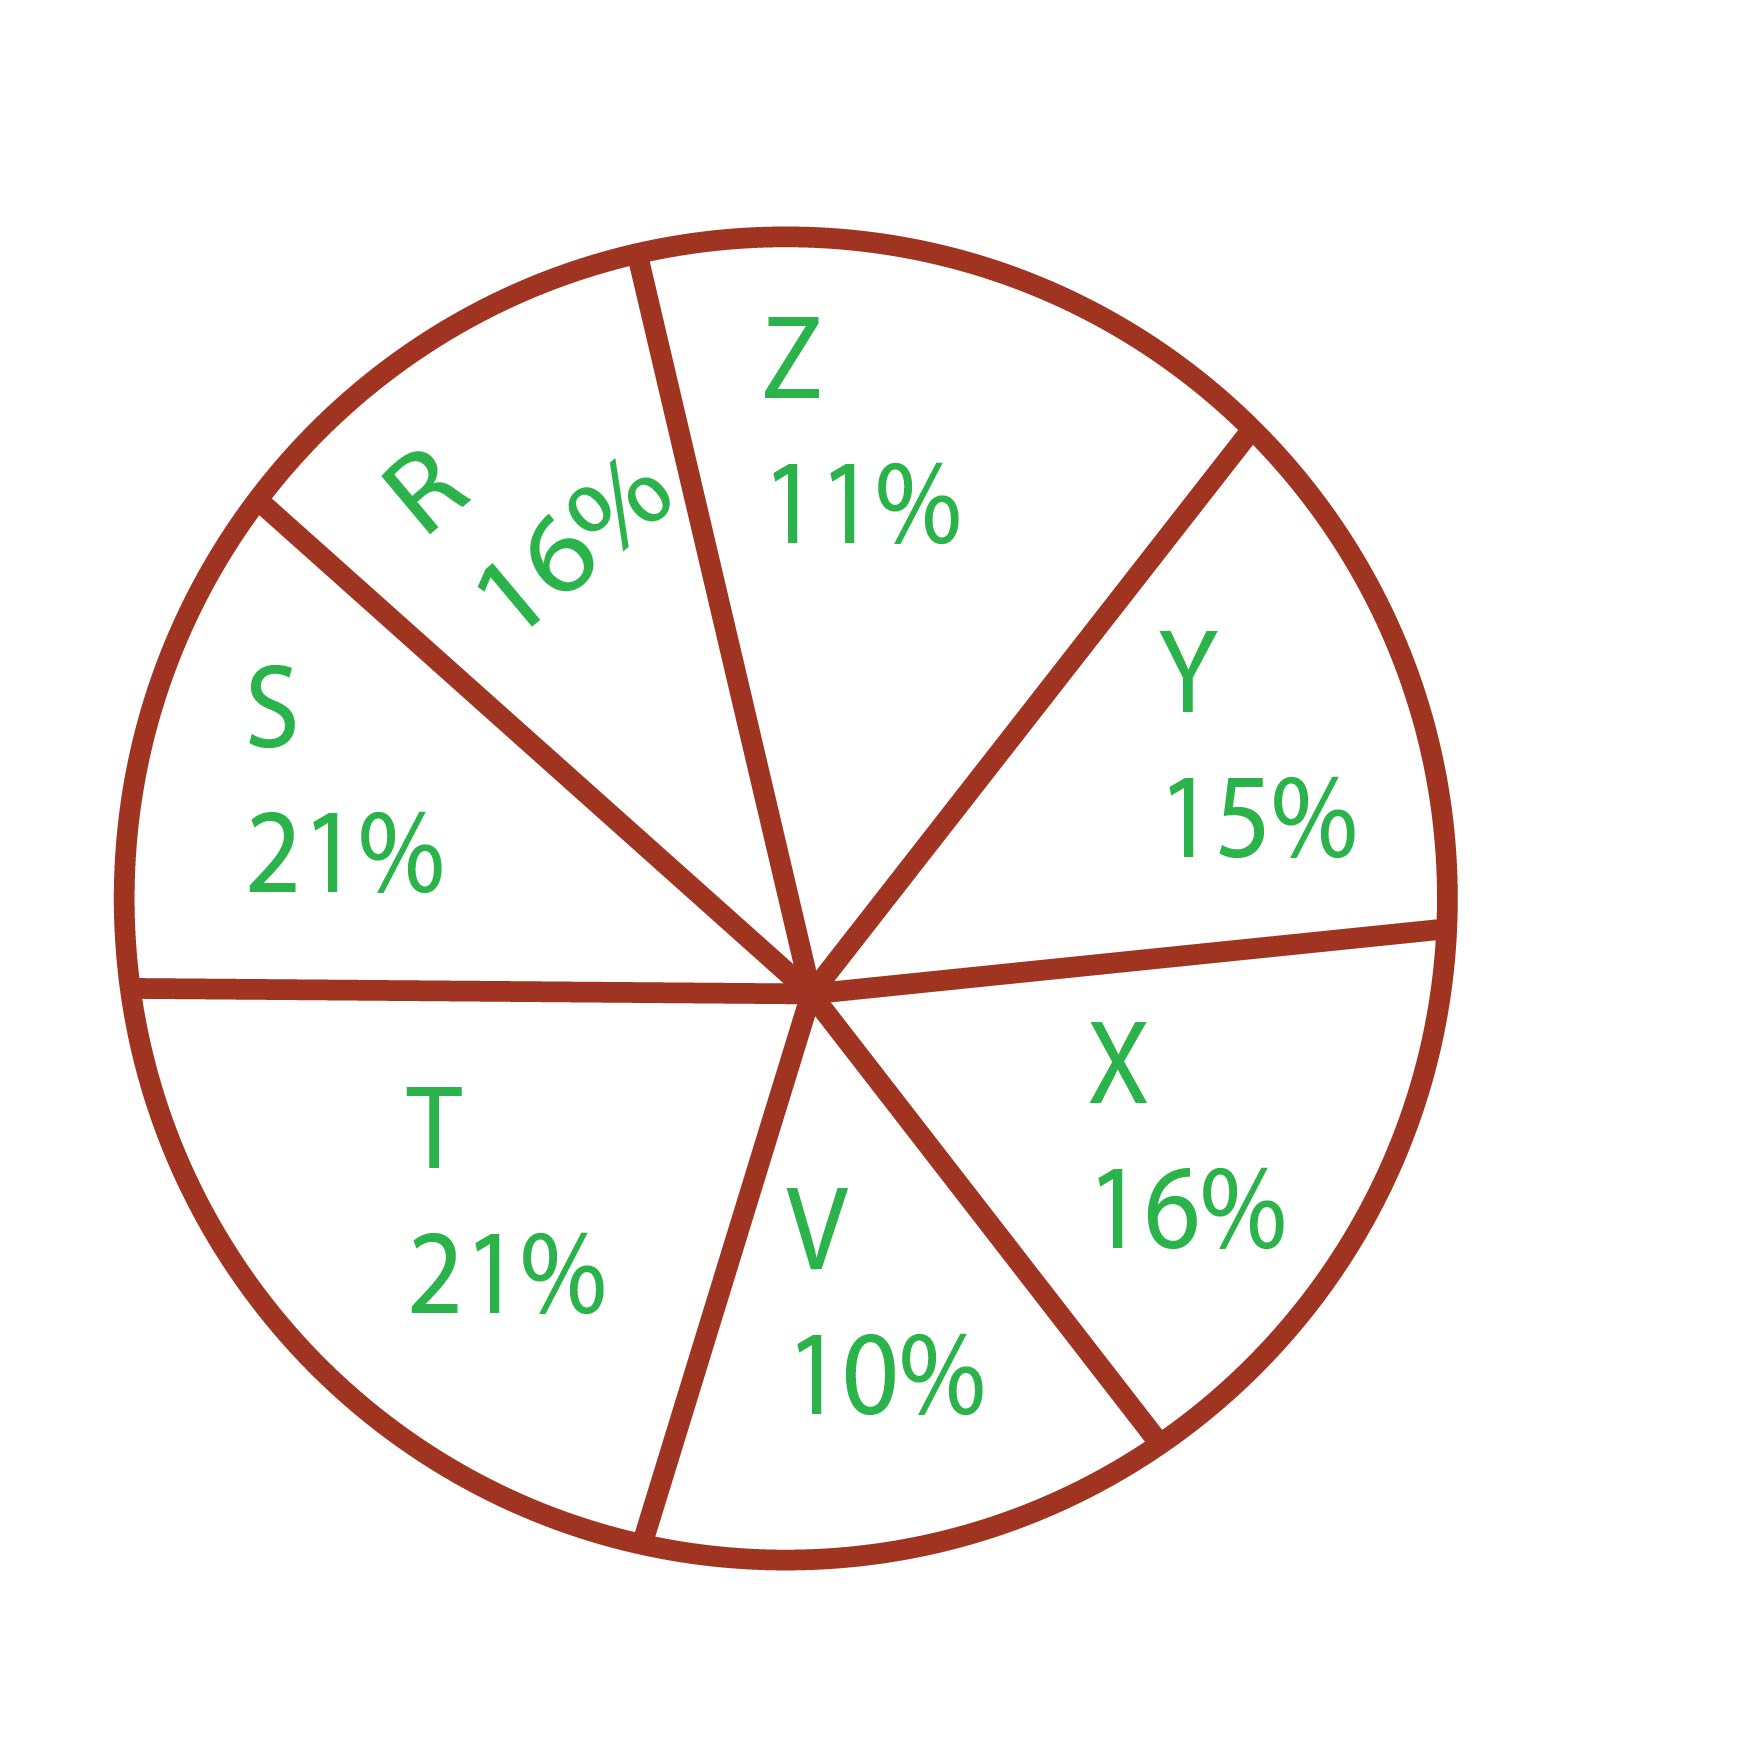
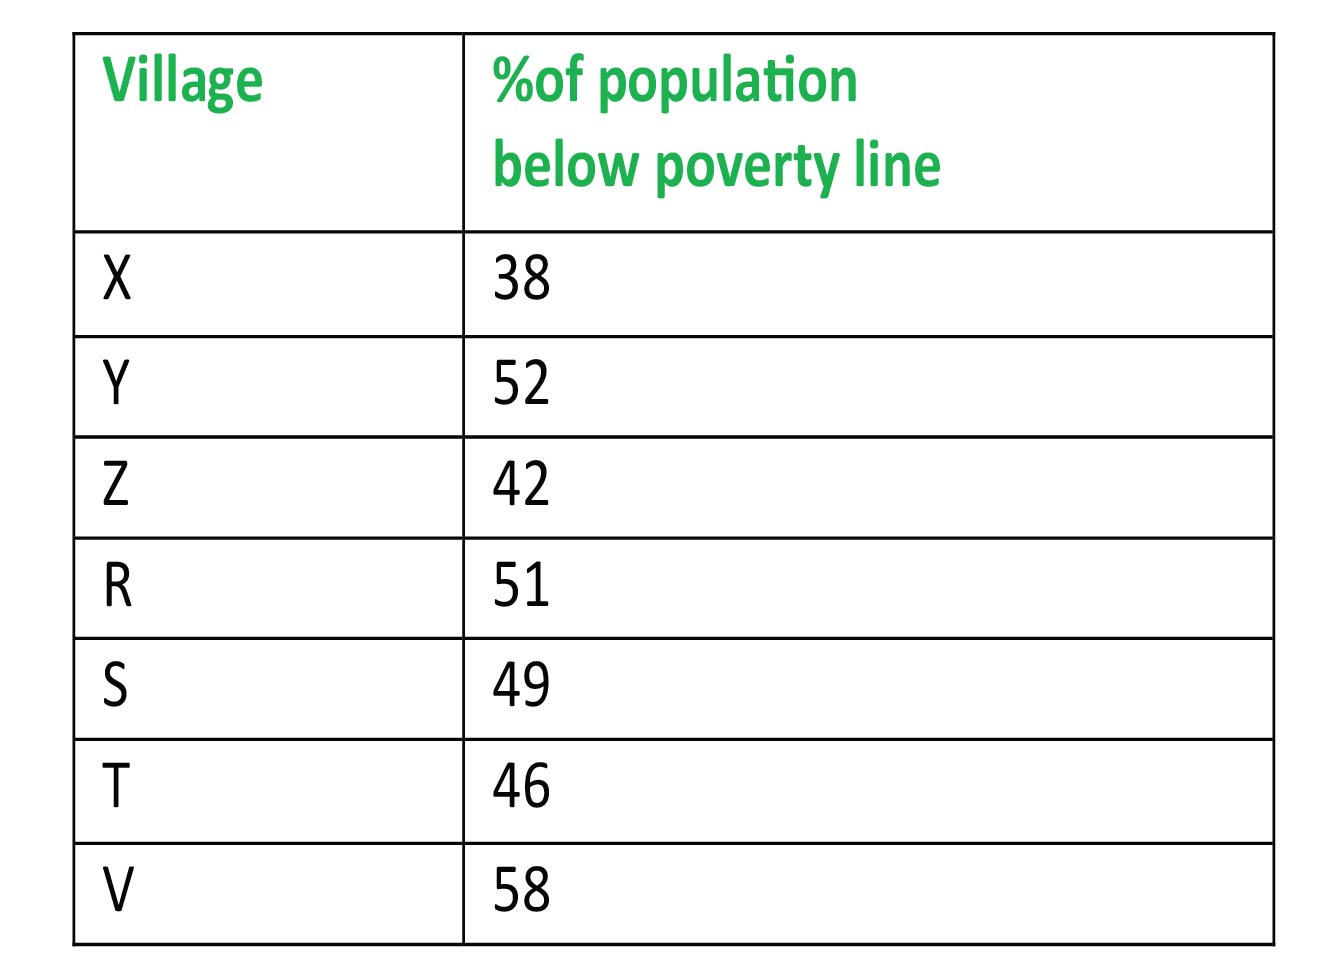
In 2010, the population of 'Y' and 'V' increases by 10% each and the percentage of population below poverty line remains unchanged for all the villages. If in 2009, the population of village Y was 30,000 then the below poverty line population of village 'V' in 2010 is-
783 0640880d7a37bb1a5e16a5bdb
640880d7a37bb1a5e16a5bdb- 111250false
- 212760true
- 313140false
- 413780false
- Show AnswerHide Answer
- Workspace
- SingleChoice
Answer : 2. "12760"
Q:Directions : The following graph shows production (in thousands) of two types (P and Q) of vehicles by a factory over the years 2009 to 2014. Study the graph and answer the given questions.
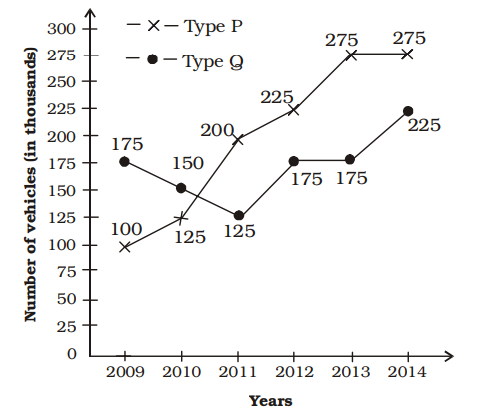
The ratio of total production of Type P vehicles to total production of type Q vehicles over the years is
782 063a56da8b580da5a6237fd52
63a56da8b580da5a6237fd52 - 148 : 41true
- 25 : 8false
- 35 : 8false
- 441 : 48false
- Show AnswerHide Answer
- Workspace
- SingleChoice
Answer : 1. "48 : 41 "
Q:Directions: The following Pie Chart shows the export of different food grains from India in 2010. Study the chart and answer the questions:
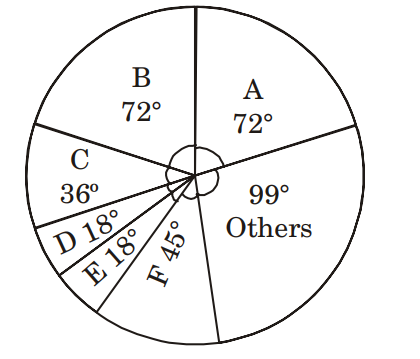
If a total of 1.5 million quintals of crop F was exported, then the total quantity of D and E that was exported (in million quintals) was
781 063be6b4261d62119f1db985c
63be6b4261d62119f1db985c- 11.2true
- 21.5false
- 34.5false
- 46.5false
- Show AnswerHide Answer
- Workspace
- SingleChoice
Answer : 1. "1.2 "
Q:Directions: The bar diagram given below shows the productions (in the unit of thousand pieces) of three types of biscuits by a company in the five consecutive years. Study the diagram and answer the following questions.
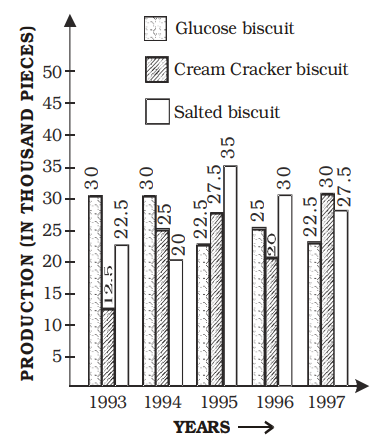
The percentage drop in the number of glucose biscuits manufactured from 1994 to 1995 is
781 064899ea4f4063d472f4a9ec8
64899ea4f4063d472f4a9ec8- 110%false
- 215%false
- 325%true
- 420%false
- Show AnswerHide Answer
- Workspace
- SingleChoice