Aptitude Practice Question and Answer
8 Q: If△ABC ∼ △EDF such that AB = 6 cm, DF = 16 cm and DE = 8 cm, then the length of BC is:
760 0647f3490f4063d472f2cd287
647f3490f4063d472f2cd287- 18 cmfalse
- 210 cmfalse
- 312 cmtrue
- 414 cmfalse
- Show AnswerHide Answer
- Workspace
- SingleChoice
Answer : 3. "12 cm "
Q:Directions: Degree- wise breakup of employees working in various department of an organisation and the ratio to men to women.
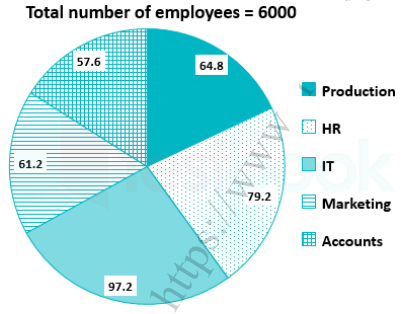
Respective ratio of men to women in each department
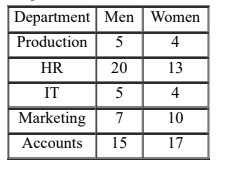
The number of men working in the IT department of the Organisation is approximately what percent of the total number of employees working in that department?
760 064da039fe0ce5574969ee2ab
64da039fe0ce5574969ee2ab- 124%false
- 256%true
- 340%false
- 472%false
- 550%false
- Show AnswerHide Answer
- Workspace
- SingleChoice
Answer : 2. "56%"
Q: 4% of the selling price of an article is equal to 5% of its cost price. Again 20% of the selling price is Rs. 120 more than 22% of its cost price. The ratio of cost price & selling price is
759 06400bd4586fd4161466ad5aa
6400bd4586fd4161466ad5aa- 12:3false
- 24:5true
- 33:2false
- 45:4false
- Show AnswerHide Answer
- Workspace
- SingleChoice
Answer : 2. "4:5"
Q:In the given question, two equations numbered l and II are given. Solve both the equations and mark the appropriate answer.
I. 2x2 + 5x - 3 = 0
II. y2 - 14y + 24 = 0
756 064e757c1d928d8b716137b18
64e757c1d928d8b716137b18- 1x > yfalse
- 2x < ytrue
- 3x ≥ yfalse
- 4x ≤ yfalse
- 5x = y or relationship between x and y cannot be established.false
- Show AnswerHide Answer
- Workspace
- SingleChoice
Answer : 2. "x < y"
Q:Directions: Student’s strength of a college in Arts, Science and Commerce from 2004-05 to 2007- 08 sessions are shown in the following bar graph. Study the graph and answer the questions
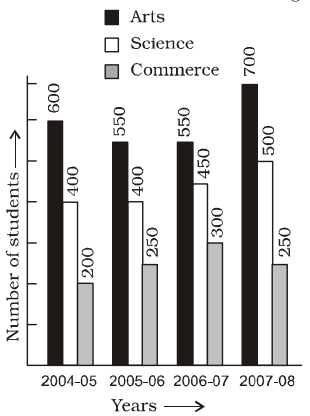
The ratio of average number of students in Arts to the average number of students in Commerce is
755 063f35c75aa2a114c952ed6bb
63f35c75aa2a114c952ed6bb- 112 : 5true
- 210 : 7false
- 37 : 4false
- 448 : 35false
- Show AnswerHide Answer
- Workspace
- SingleChoice
Answer : 1. "12 : 5 "
Q:Directions : The following graph shows production (in thousands) of two types (P and Q) of vehicles by a factory over the years 2009 to 2014. Study the graph and answer the given questions.
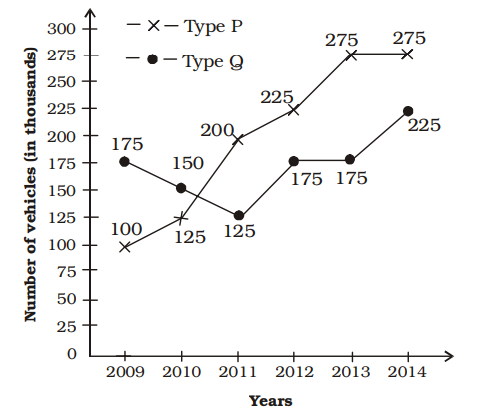
The total production of Type P vehicles in the years 2009 and 2011 is what percent of total production of Type Q vehicles in 2010 and 2014?
754 063a56d3024e8fb08b9fe2176
63a56d3024e8fb08b9fe2176 - 175false
- 269.25false
- 380true
- 481.25false
- Show AnswerHide Answer
- Workspace
- SingleChoice
Answer : 3. "80 "
Q:Directions : The Bar Graph given here shows the population (in crores) of India in various census years. Observe the graph and answer the question based on it.
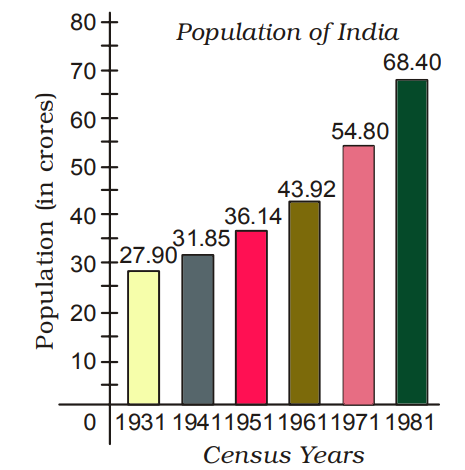
In which census year, the per cent increase in population is highest as compared to that in the previous census year?
753 06453a943613f9f6e3315cfe5
6453a943613f9f6e3315cfe5- 11951false
- 21961false
- 31971false
- 41981true
- Show AnswerHide Answer
- Workspace
- SingleChoice
Answer : 4. "1981 "
Q:Direction: Read the following table carefully and answer the following questions: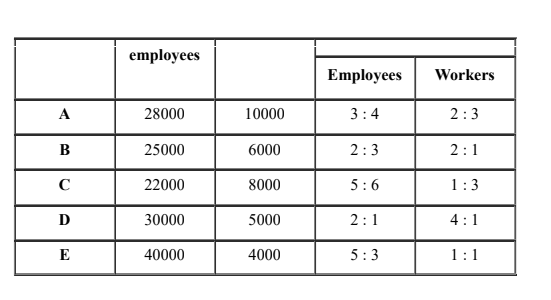
What is the ratio between the number of female workers and female employees of five companies?
753 064d4e3a5d02c5c746bdce983
64d4e3a5d02c5c746bdce983- 11 : 5false
- 21 : 4true
- 32 : 5false
- 41 : 3false
- 52 : 3false
- Show AnswerHide Answer
- Workspace
- SingleChoice