Aptitude Practice Question and Answer
8 Q: The length of a rectangle is in- creased by 10% and breadth de- creased by 10%. Then the area of the new rectangle is:
704 06400abfd86fd4161466ab665
6400abfd86fd4161466ab665- 1neither decreased nor increasedfalse
- 2increased by 1%false
- 3decreased by 1%true
- 4decreased 10%false
- Show AnswerHide Answer
- Workspace
- SingleChoice
Answer : 3. "decreased by 1% "
Q:Direction: In the given question, two equations numbered l and II are given. Solve both the equations and mark the appropriate answer.
I. x² – 12x + 32 = 0
II. 2y² – 9y + 10 = 0
704 064dcc486d4a4292bfff45c04
64dcc486d4a4292bfff45c04II. 2y² – 9y + 10 = 0
- 1x > ytrue
- 2x < yfalse
- 3x ≥ yfalse
- 4x ≤ yfalse
- 5x = y or the relationship between x and y cannot be established.false
- Show AnswerHide Answer
- Workspace
- SingleChoice
Answer : 1. "x > y"
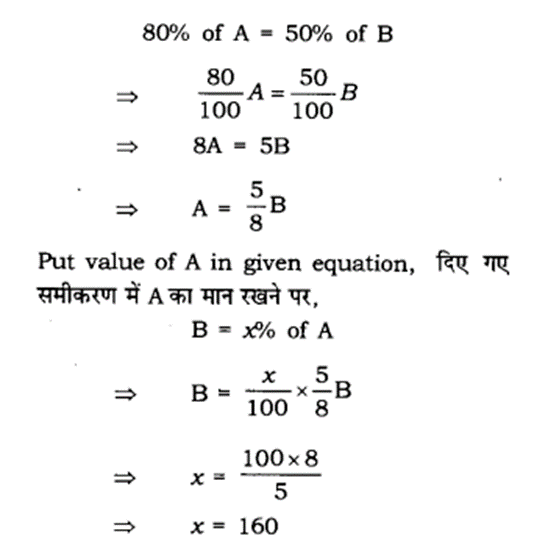
Q: If 80% of A=50% of B and B = x% of A, then the value of x is :
692 0653f6a6bae39fbcb144621e3
653f6a6bae39fbcb144621e3- 1400false
- 2300false
- 3160true
- 4150false
- Show AnswerHide Answer
- Workspace
- SingleChoice
Answer : 3. "160"
Explanation :
Q:Directions : Given here is a pie chart showing the cost of gold in 2010, 2011, 2012 and 2013. Study the chart and answer the following questions
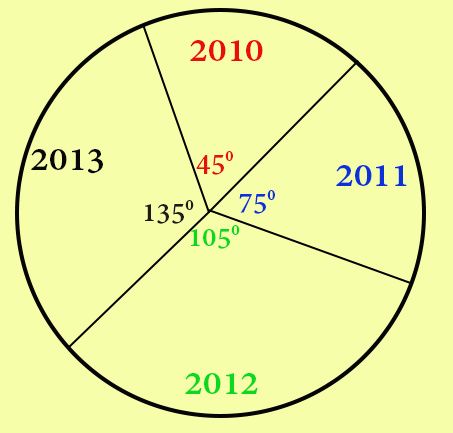
The ratio of percentage increases in price of gold from 2011 to 2012 and 2012 to 2013 is
691 064539f4739143d085f3e3c04
64539f4739143d085f3e3c04- 16 : 5false
- 27 : 5true
- 38 : 5false
- 49 : 5false
- Show AnswerHide Answer
- Workspace
- SingleChoice
Answer : 2. "7 : 5"
Q:Directions : Read the graph and answer the following questions.
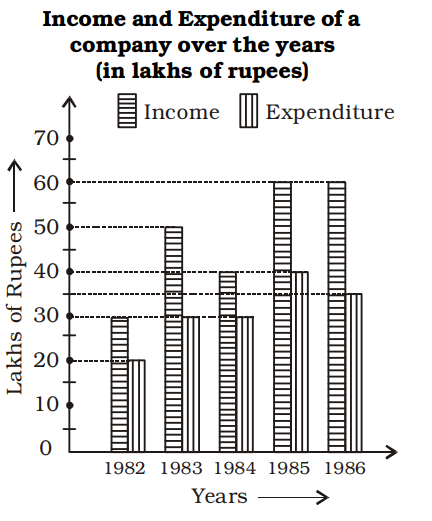
The number of years in which the income is more than the average income of the given years is
685 06461029dc899b466f4459a5c
6461029dc899b466f4459a5c- 1Onefalse
- 2Twofalse
- 3Threetrue
- 4Fourfalse
- Show AnswerHide Answer
- Workspace
- SingleChoice
Answer : 3. "Three"
Q:Directions : Study the following bar graph and answer the questions.
company (in lakhs of rupees) for the years 1994-1997:
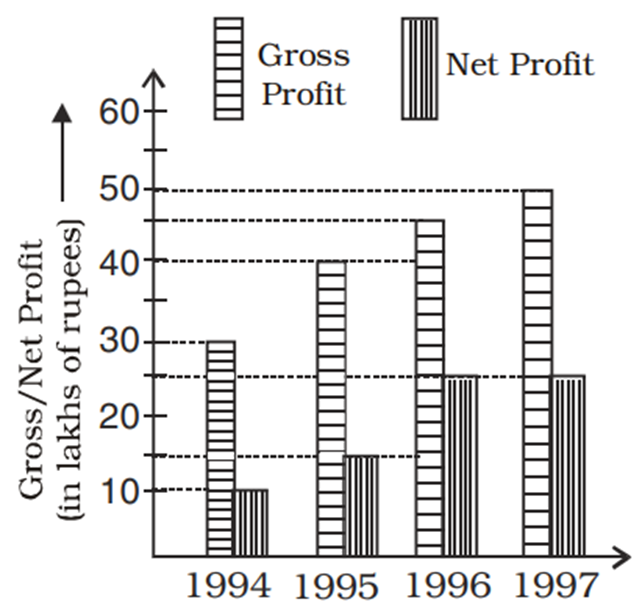
The year in which the gross profit is double the net profit
679 06460f4e7c899b466f4458a0a
6460f4e7c899b466f4458a0a- 11997true
- 21995false
- 31996false
- 41994false
- Show AnswerHide Answer
- Workspace
- SingleChoice
Answer : 1. "1997 "
Q:Direction: The line chart given below shows number of labourers (men and women) working in six different years. Study the data carefully and answer the following questions.
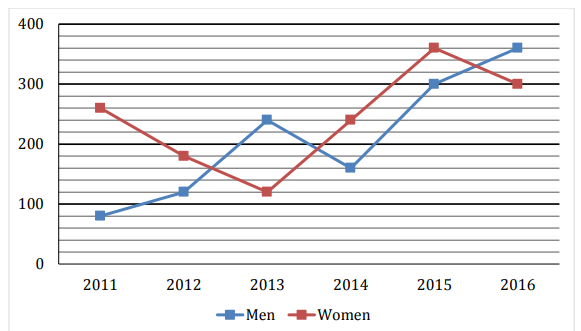
The total number of Men working in 2012 and 2013 together is what per cent of the total number of labourers (Men + Women) working in 2014?
675 064d4ad07ebd5c3747277b3a4
64d4ad07ebd5c3747277b3a4- 160%false
- 270%false
- 380%false
- 490%true
- 540%false
- Show AnswerHide Answer
- Workspace
- SingleChoice
Answer : 4. "90%"
Q: In the given question, two equations numbered l and II are given. Solve both the equations and mark the appropriate answer.
I. x2– 37x + 330 = 0
II. y2– 28y + 195 = 0
673 064d9f82de0ce5574969e94f7
64d9f82de0ce5574969e94f7- 1x > yfalse
- 2x < yfalse
- 3x ≥ ytrue
- 4x ≤ yfalse
- 5x = y or relationship between x and y cannot be established.false
- Show AnswerHide Answer
- Workspace
- SingleChoice