Data Interpretation Questions Practice Question and Answer
8 Q: The bar graph given below shows the sales of books (in thousand number) from six branches - B1, B2, B3, B4 , B5 and B6 of a publishing company during two consecutive years 2000 and 2001.
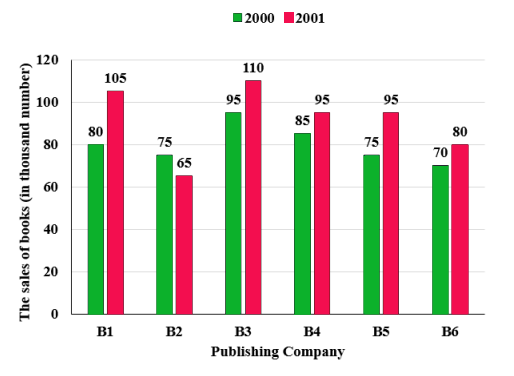
Find the percentage (approximate) of the average sales of branches B2, B4 and B6 in the year 2001 to the average sales of branches B1, B3 and B5 in the year 2001.
1991 06450e07f39143d085f375b8b
6450e07f39143d085f375b8b- 197.95%false
- 282.26%false
- 377.42%true
- 492%false
- Show AnswerHide Answer
- Workspace
- SingleChoice
Answer : 3. "77.42% "
Q:Directions: The Bar Graph given here shows the population (in crores) of India in various census years. Observe the graph and answer the question based on it.
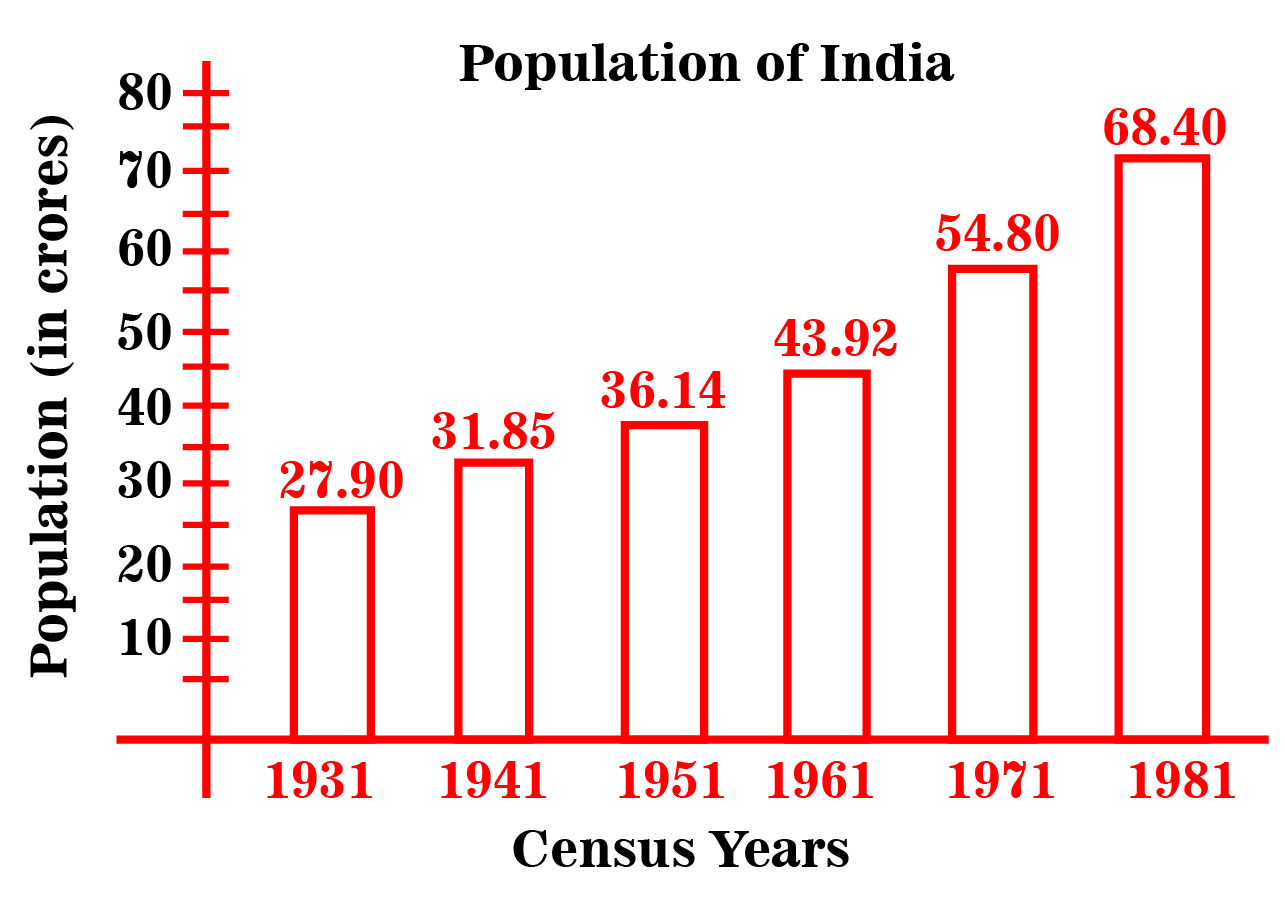
In which census year, the percent increase in population is highest as compared to that in the previous census year?
1987 05ea8113ca63dac4c26cb72b8
5ea8113ca63dac4c26cb72b8- 11951false
- 21961false
- 31971false
- 41981true
- 5None of thesefalse
- Show AnswerHide Answer
- Workspace
- SingleChoice
Answer : 4. "1981"
Q: Study the following graph and answer the question that follow.
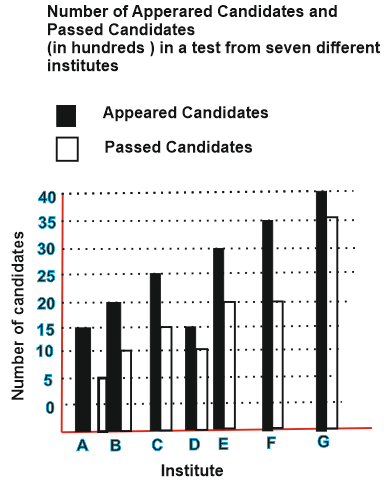 From which institute is the difference between the appeared candidates and passed candidates maximum?
1984 05d860d9bd0d7a00e4ecbb1b4
5d860d9bd0d7a00e4ecbb1b4From which institute is the difference between the appeared candidates and passed candidates maximum?- 1Bfalse
- 2Gfalse
- 3Dfalse
- 4Ftrue
- 5None of thesefalse
- Show AnswerHide Answer
- Workspace
- SingleChoice
Answer : 4. "F"
Q:Direction: Study the following graph carefully and answer the questions that follow:
The graph given below represents the number of users of two broadband services A and B across 5 cities P, Q, R, S and T.
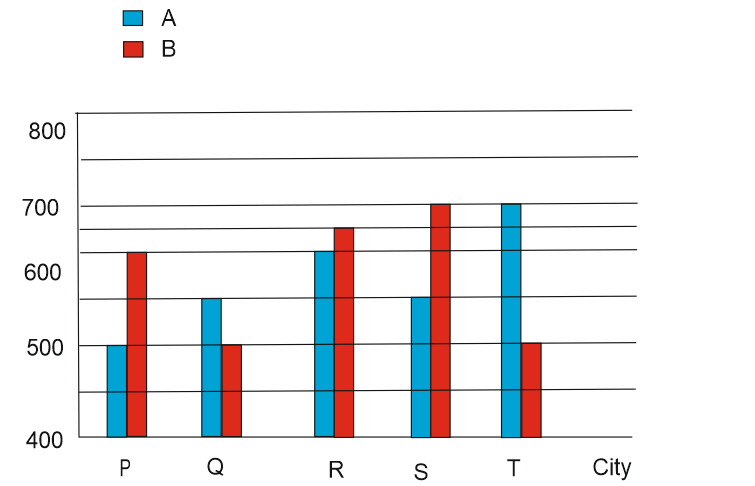
What is the respective ratio of the number of users of brand A in city P to the number of users of brand B in the City S?
1972 05df0be0ee837331209ea1ec0
5df0be0ee837331209ea1ec0The graph given below represents the number of users of two broadband services A and B across 5 cities P, Q, R, S and T.
- 15:7true
- 24:7false
- 32:5false
- 43:4false
- 55:6false
- Show AnswerHide Answer
- Workspace
- SingleChoice
Answer : 1. "5:7"
Q:Direction: Given bar graph shows the number of plain books and lined books (in hundreds) available at three different stores and the table shows the percentage of total books (Plain + lined) that was sold by different stores.
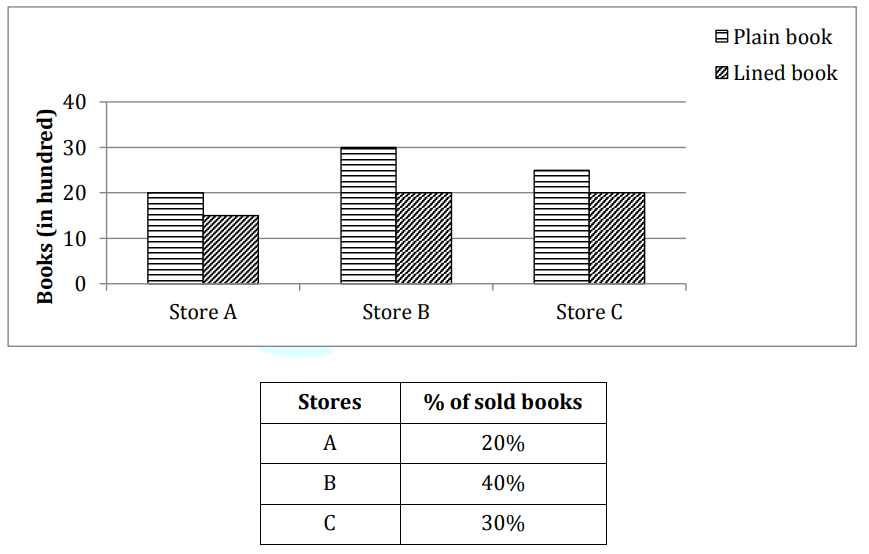
The ratio of sold plain and lined books for store C is 5 : 4 and for store B is 3 : 2. Then find the total plain books sold by these two stores together?
1971 0603f3c5f251bf6540042e08d
603f3c5f251bf6540042e08d- 11950true
- 21975false
- 31750false
- 41825false
- 51850false
- Show AnswerHide Answer
- Workspace
- SingleChoice
Answer : 1. "1950 "
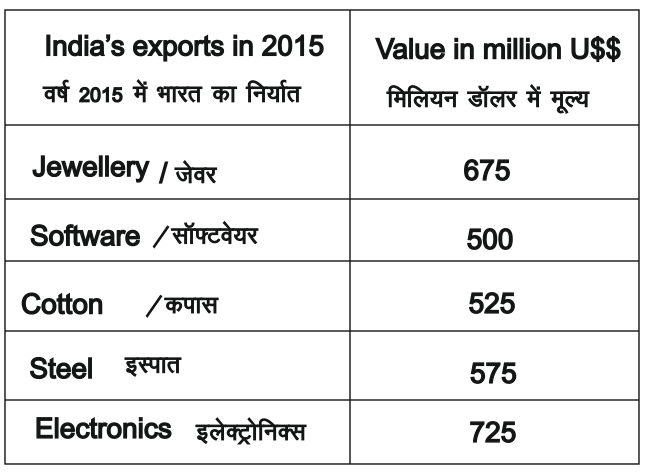
Q: Refer the below data table and answer the following question.
Jewellery was what percent of total exports?
1959 05f0e85011090a058653eba82
5f0e85011090a058653eba82Jewellery was what percent of total exports?
- 122.5 %true
- 225 %false
- 320 %false
- 427.5 %false
- Show AnswerHide Answer
- Workspace
- SingleChoice
Answer : 1. "22.5 %"
Q:Directions: Study the following pie chart carefully and answer the questions given beside.
The following pie chart gives the information about breakup of six different categories of workers in a company.
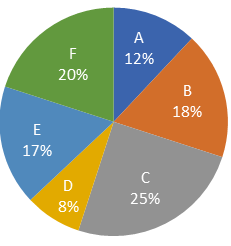
In category A, the ratio of male workers to female workers is 2 : 3. The number of female workers in category A is what percentage of the total number of workers in category F?
1947 0601a5493552e5f41f7b07ea7
601a5493552e5f41f7b07ea7The following pie chart gives the information about breakup of six different categories of workers in a company.
- 135.5%false
- 238%false
- 337.5%false
- 436%true
- Show AnswerHide Answer
- Workspace
- SingleChoice
Answer : 4. "36%"
Q:Directions: The Bar Graph given here shows the population (in crores) of India in various census years. Observe the graph and answer the question based on it.
In which census year, the percent increase in population is least as compared to that in the previous census year?
1946 05ea811ae3b50714be9b1d5c9
5ea811ae3b50714be9b1d5c9- 11961false
- 21951true
- 31971false
- 41941false
- 5None of thesefalse
- Show AnswerHide Answer
- Workspace
- SingleChoice