Data Interpretation Questions Practice Question and Answer
8 Q:Read the following graph carefully and answer the related questions-
Total number of students (in thousands) participating in comitative exam in various cities.
What is the average number of students appearing in competitive exam from all the states together?
1883 0602379a32dc71d4148a57f88
602379a32dc71d4148a57f88- 133500false
- 23350false
- 317500false
- 4None of thesetrue
- Show AnswerHide Answer
- Workspace
- SingleChoice
Answer : 4. "None of these "
Q: Study the following graph and answer the question that follow.
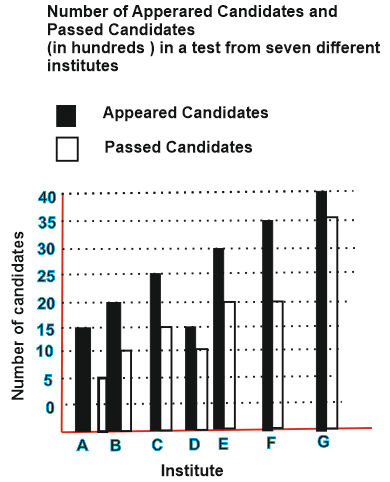 Number of candidates passed form institutes C and E together is approximately what percentage of the total number of candidates appeared from institutes A and G together?
1876 05d860ea0a08f7a4080524e93
5d860ea0a08f7a4080524e93Number of candidates passed form institutes C and E together is approximately what percentage of the total number of candidates appeared from institutes A and G together?- 172false
- 264true
- 354false
- 477false
- 568false
- Show AnswerHide Answer
- Workspace
- SingleChoice
Answer : 2. "64"
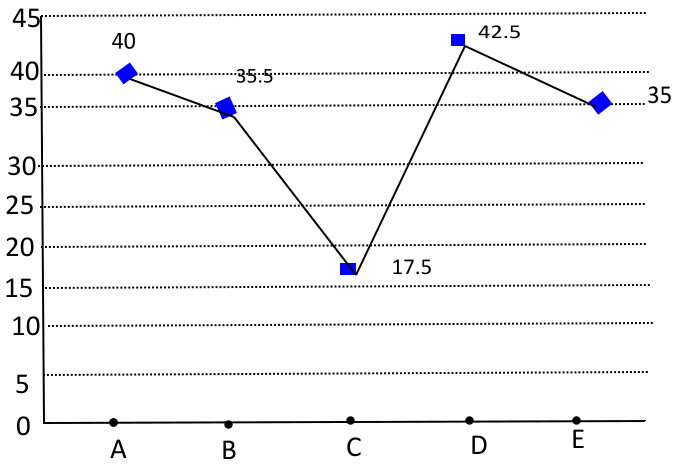
Q:Directions : A graph showing the price of rice in India during the year 2000 to 2003 is given below. Study the graph carefully and answer the questions.

The maximum difference in price between any two years was in the month of
1871 06391d85f58400a550dd8e127
6391d85f58400a550dd8e127- 1Januaryfalse
- 2Novemberfalse
- 3Marchfalse
- 4Decembertrue
- Show AnswerHide Answer
- Workspace
- SingleChoice
Answer : 4. "December"
Q:Study the following table carefully and answer the questions given below.
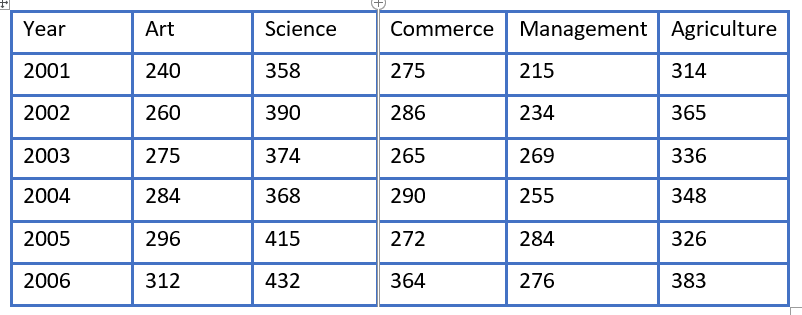
The total number of students in Agriculture in 2001 and 2005 together was approximately what percent of number of students from the same discipline in 2002?
1870 05da04fbc77652578d4eff0a2
5da04fbc77652578d4eff0a2- 175false
- 2165false
- 365false
- 4175true
- 5190false
- Show AnswerHide Answer
- Workspace
- SingleChoice
Answer : 4. "175"
Q:Study the given graph carefully to answer the questions that follow:
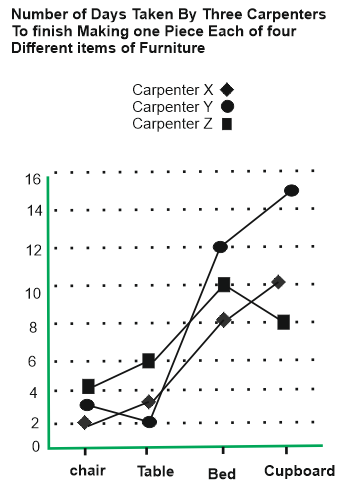
If carpenter X, Y and Z were to make a table together how many days would they take?
1869 05d85d054a08f7a408051b773
5d85d054a08f7a408051b773- 14 daysfalse
- 23 daysfalse
- 31 daystrue
- 42 daysfalse
- Show AnswerHide Answer
- Workspace
- SingleChoice
Answer : 3. "1 days"
Q:Study the following bar chart and answer the questions carefully.
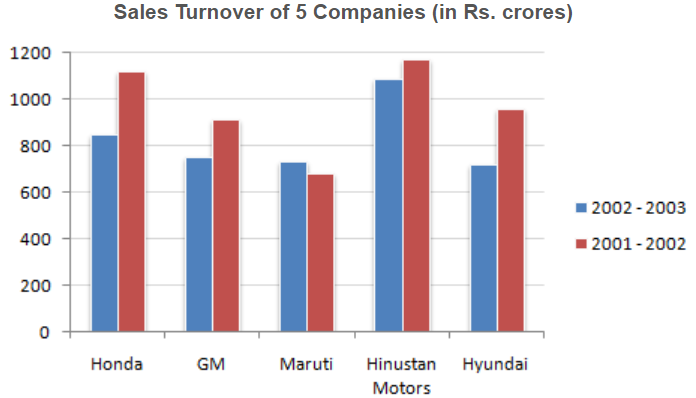
What is the percentage change in the overall sales turnover of the five companies together between 2001 - 2002 and 2002 - 2003 ?
1864 05fd33a80eddcb86a7ee3ab40
5fd33a80eddcb86a7ee3ab40- 117.21 %false
- 214.68 %true
- 312.67 %false
- 421.24 %false
- 522.33 %false
- Show AnswerHide Answer
- Workspace
- SingleChoice
Answer : 2. "14.68 %"
Q:Study the graph carefully and answer the following questions.
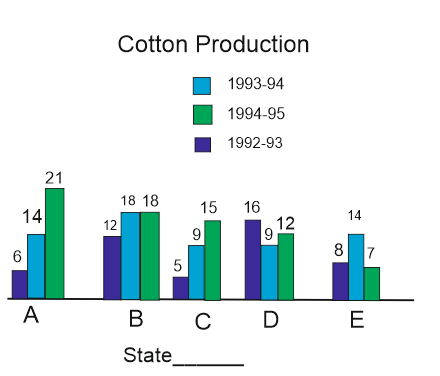
How many state showing above average production in 1992-93 showed below average production in 1993-94 ?
1858 05f15635deddbc50839d5259a
5f15635deddbc50839d5259a- 14false
- 22true
- 33false
- 41false
- Show AnswerHide Answer
- Workspace
- SingleChoice
Answer : 2. "2"
Q:Direction: The following graph shows the number of boys and girls in Class V, Class VI, Class VII and Class VIII. Study the graph and answer the question.
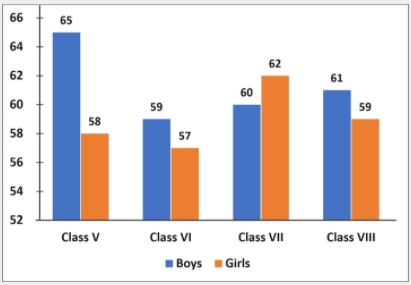
Which class has the maximum number of students?
1845 06037520124cd273bc4f4ac9d
6037520124cd273bc4f4ac9d- 1Class VIfalse
- 2Class VIIIfalse
- 3Class Vtrue
- 4Class VIfalse
- Show AnswerHide Answer
- Workspace
- SingleChoice