Data Interpretation Questions Practice Question and Answer
8 Q:Directions: Study the following pie chart carefully and answer the questions given beside.
The following pie chart gives the information about breakup of six different categories of workers in a company.
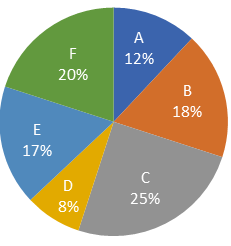
One day, all the workers were present except 25 out of 102 of category E workers. Find the number of workers present on that day?
1637 0601a5563c12de45b38e20157
601a5563c12de45b38e20157The following pie chart gives the information about breakup of six different categories of workers in a company.
- 1600false
- 2625false
- 3550false
- 4575true
- Show AnswerHide Answer
- Workspace
- SingleChoice
Answer : 4. "575"
Q:Directions-Study the following diagram and answer the four questions.
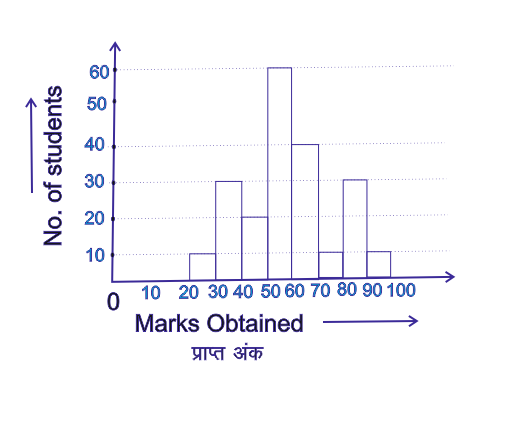
The total no. of students on whom this survey was made is
1637 05daea79bcca75847f4d932e8
5daea79bcca75847f4d932e8- 1190false
- 2200false
- 3220false
- 4210true
- Show AnswerHide Answer
- Workspace
- SingleChoice
Answer : 4. "210"
Q:Directions: The bar graph given below shows the spending of family income on various items and savings during 1993. Observe the graph and answer the following questions:
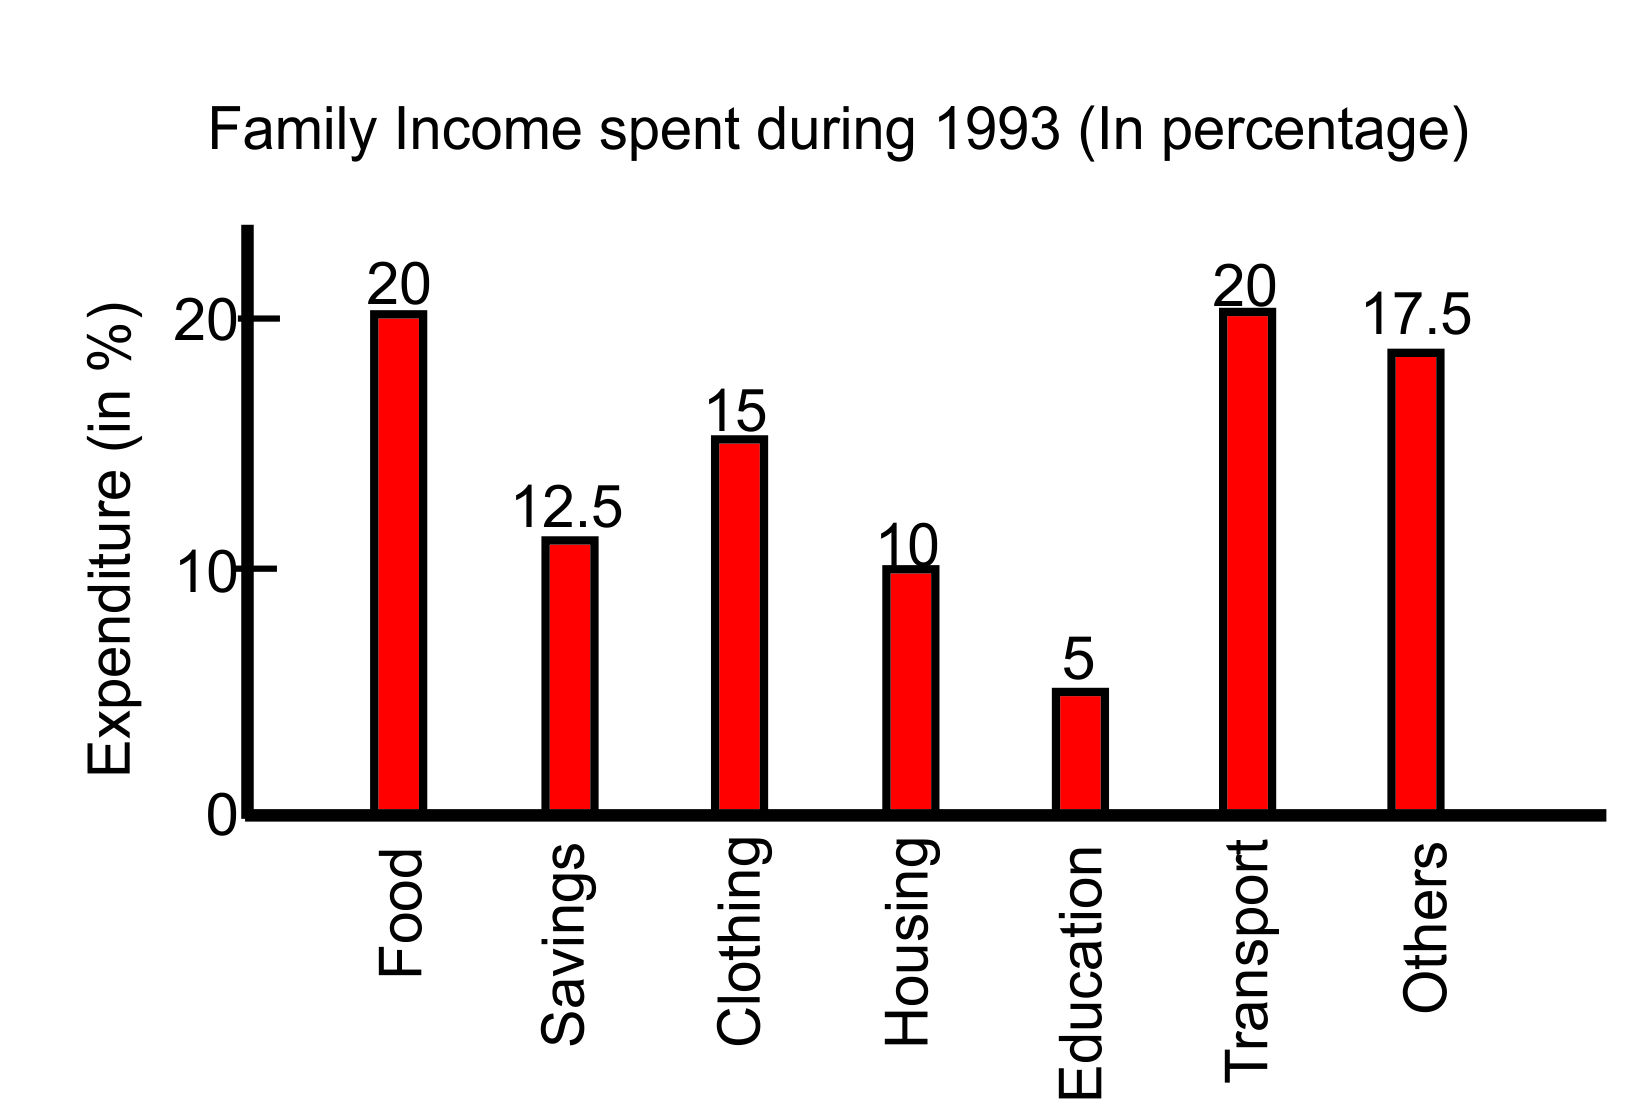
The percent of income spent on clothing exceeds that on savings by :
1636 05def3b986d799a05c00a472c
5def3b986d799a05c00a472c- 112.5 %false
- 22.5 %true
- 310%false
- 422.5 %false
- Show AnswerHide Answer
- Workspace
- SingleChoice
Answer : 2. "2.5 % "
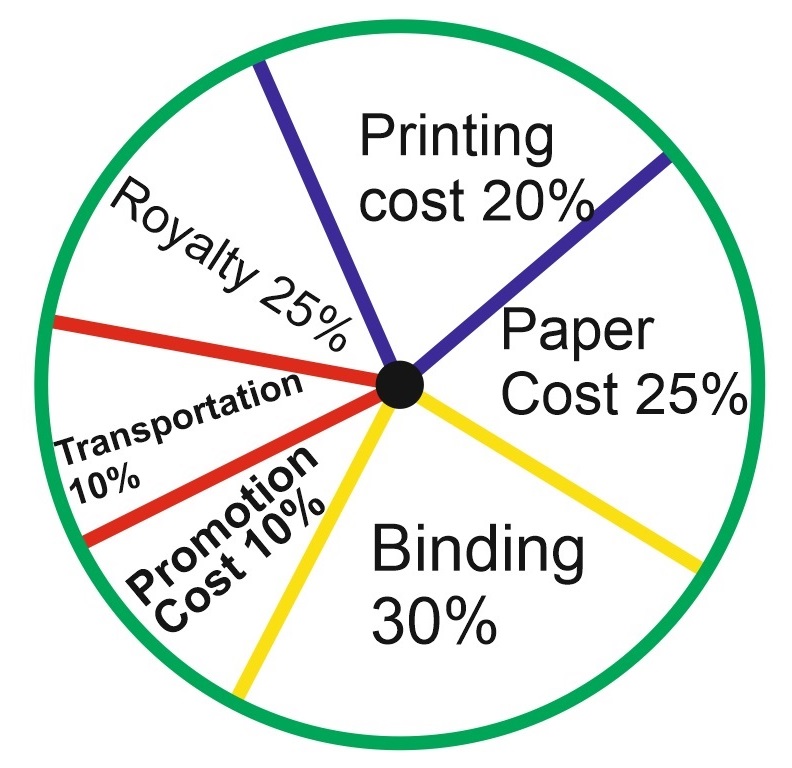
Q: If the difference between the two expenditures is represented by 1800 in the pie-chart, then these expenditures possibly are:
1627 05d70c99ed8eebc768d114081
5d70c99ed8eebc768d114081
- 1Binding Cost and Promotion Costfalse
- 2Paper Cost and Royaltyfalse
- 3Binding Cost and Printing Costfalse
- 4Paper Cost and Printing Costtrue
- Show AnswerHide Answer
- Workspace
- SingleChoice
Answer : 4. "Paper Cost and Printing Cost"
Q:The pie chart given below shows the number of shoes of 5 different brands in a multi brand store. There are total 1200 shoes.
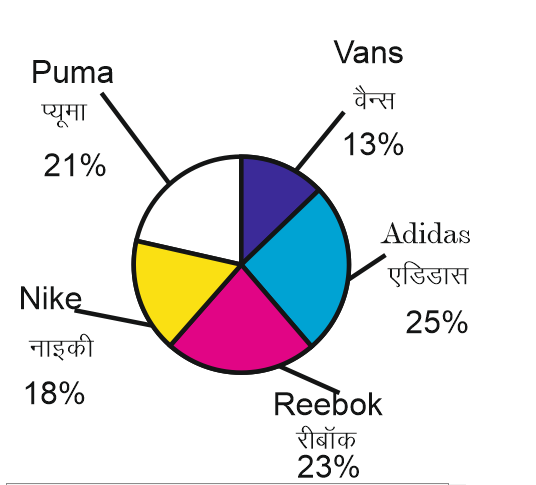
How many shoes are there of Reebok brand?
1624 05efeb3dd7228dd6b06e75566
5efeb3dd7228dd6b06e75566- 1230false
- 2276true
- 3286false
- 4216false
- Show AnswerHide Answer
- Workspace
- SingleChoice
Answer : 2. "276"
Q:Direction: Study the following table carefully and answer the given questions. Table shows the of passed students in four schools and ratio between passed boys and girls among them. The ratio between failed boys and girls is reverse of passed ratio between them.
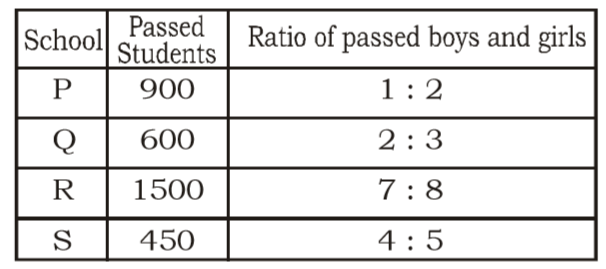
The number passed of girls from School S is approximately what percentage of passed girls from School Q?
1624 05e9d327f772f97276f50f67d
5e9d327f772f97276f50f67d- 165 %false
- 272 %false
- 375 %false
- 469 %true
- 5None of thesefalse
- Show AnswerHide Answer
- Workspace
- SingleChoice
Answer : 4. "69 % "
Q:A motorist and a scooterist made a journey of 120 km at the same time and from the same place. The graph shows the progress of the journey made by each person. Study the graph and answer the questions.
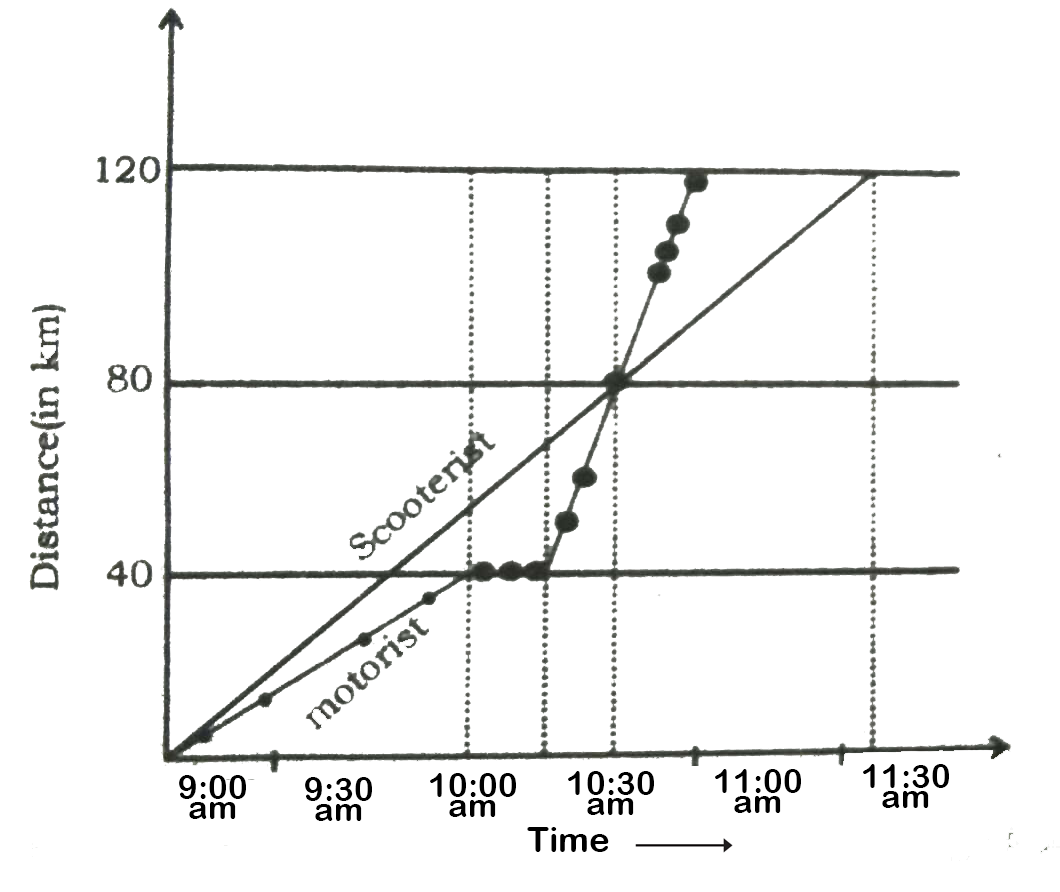
At what time did the motorist meet the scooterist?
1623 05dd67c707780ee35515c325a
5dd67c707780ee35515c325a- 110:30 amtrue
- 210:45 amfalse
- 310:15 amfalse
- 410:20 amfalse
- Show AnswerHide Answer
- Workspace
- SingleChoice
Answer : 1. "10:30 am "
Q:Direction: Percentage of different types of employees in a company in two consecutive years.
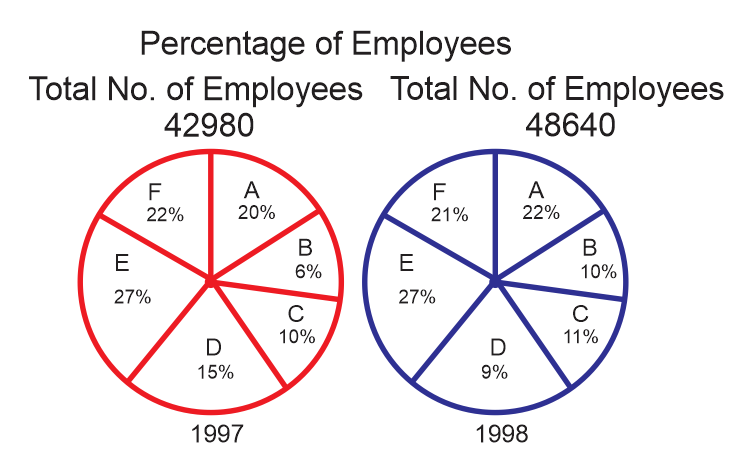
In 1997 the total number of which of the following types of pairs of employees was approximately equal to the employees in 1998?
1619 05e3274271f73627362283556
5e3274271f73627362283556- 1D and Efalse
- 2C and Dtrue
- 3A and Cfalse
- 4B and Cfalse
- Show AnswerHide Answer
- Workspace
- SingleChoice