Data Interpretation Questions Practice Question and Answer
8 Q:Direction: Study the following graph carefully and answer the questions that follow:
The graph given below represents the number of users of two broadband services A and B across 5 cities P, Q, R, S and T.
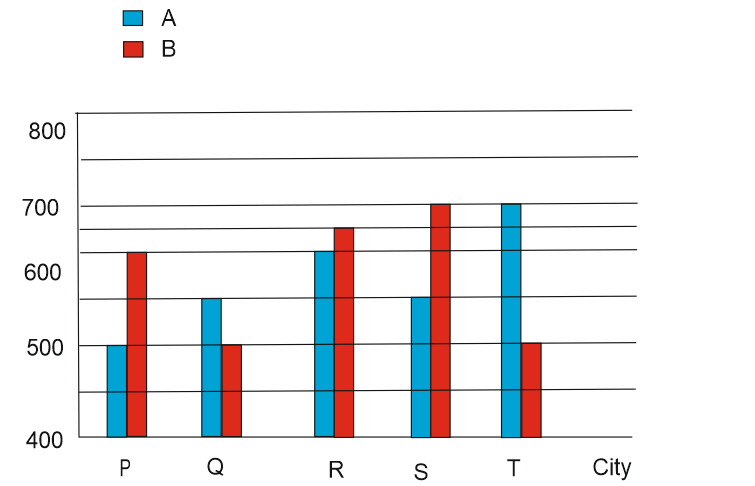
What is the average number of users of brand A across all five cities together?
1618 05df0bcc53d76f974e561f6f3
5df0bcc53d76f974e561f6f3The graph given below represents the number of users of two broadband services A and B across 5 cities P, Q, R, S and T.
- 1560false
- 2570false
- 3580true
- 4590false
- 5550false
- Show AnswerHide Answer
- Workspace
- SingleChoice
Answer : 3. "580"
Q:Directions: Read the following table and answer the questions below it:
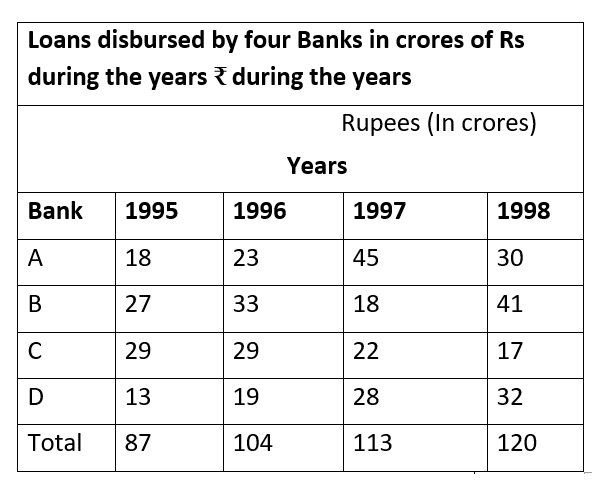
In which of the following banks, there was a continued increase in loan disbursement throughout the years?
1617 05e4e4f63701cfd31ff68f135
5e4e4f63701cfd31ff68f135- 1Afalse
- 2Bfalse
- 3Cfalse
- 4Dtrue
- Show AnswerHide Answer
- Workspace
- SingleChoice
Answer : 4. "D "
Q:Direction (94-98): Study the following table to answer the given questions.
Centre and Post-wise Numbered of candidate
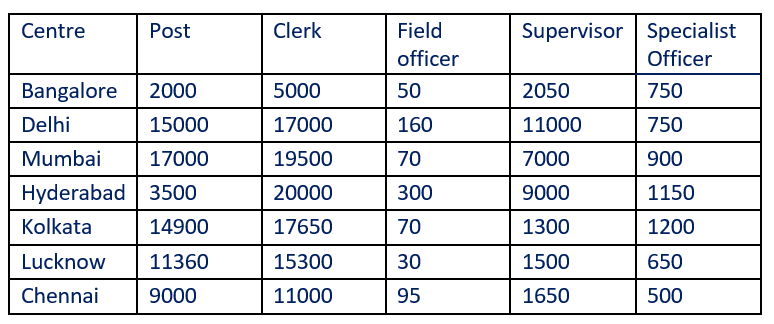
In Chennai, the number of clerks is approximately how much percent more than that of officers?
1610 05da4039f5225a412f51637c9
5da4039f5225a412f51637c9Centre and Post-wise Numbered of candidate
- 118false
- 222true
- 320false
- 42false
- 513false
- Show AnswerHide Answer
- Workspace
- SingleChoice
Answer : 2. "22"
Q:Comprehension: Read the following chart and answer the following questions.
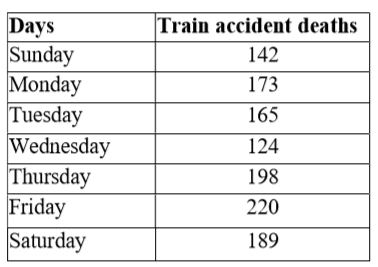
What is the average death rate per day for the week?
1609 05ebcc2da1c43d211834b4136
5ebcc2da1c43d211834b4136- 1173true
- 2172false
- 3183false
- 4163false
- Show AnswerHide Answer
- Workspace
- SingleChoice
Answer : 1. "173 "
Q:Directions: The bar graph shows the results of an annual examination in a secondary school in a certain year. Answer the following four questions based on this chart.

The average number of boys passed per class is
1607 05e8afa0ecbf02e5d98726507
5e8afa0ecbf02e5d98726507- 178false
- 272false
- 375false
- 470true
- Show AnswerHide Answer
- Workspace
- SingleChoice
Answer : 4. "70 "
Q:Directions : A graph showing the price of rice in India during the year 2000 to 2003 is given below. Study the graph carefully and answer the questions.

The range of price for a year is the difference between the maximum and the minimum prices for that year. The graph shows that this range of price was the greatest for the year
1605 06391d7ab58400a550dd8e020
6391d7ab58400a550dd8e020- 12000true
- 22001false
- 32002false
- 42003false
- Show AnswerHide Answer
- Workspace
- SingleChoice
Answer : 1. "2000 "
Q:A bar graph showing the height of six mountain peaks. Study the bar graph and answer the following Questions.
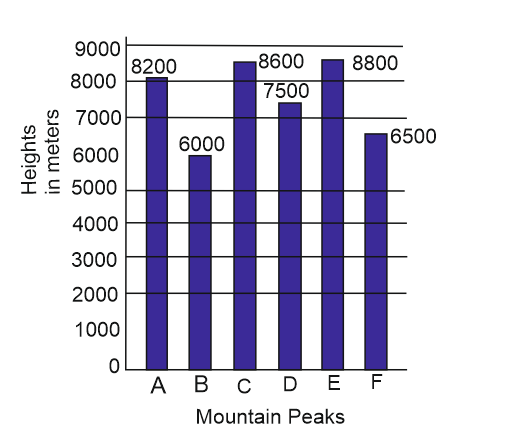
What is the ratio of the heights of the highest peak and the lowest peak?
1604 05f06dfa93f7f07047795f91a
5f06dfa93f7f07047795f91a- 115 : 22false
- 222 : 15true
- 320 : 13false
- 420 : 13false
- Show AnswerHide Answer
- Workspace
- SingleChoice
Answer : 2. "22 : 15"
Q:Directions: The bar graph given below shows the spending of family income on various items and savings during 1993. Observe the graph and answer the following questions:
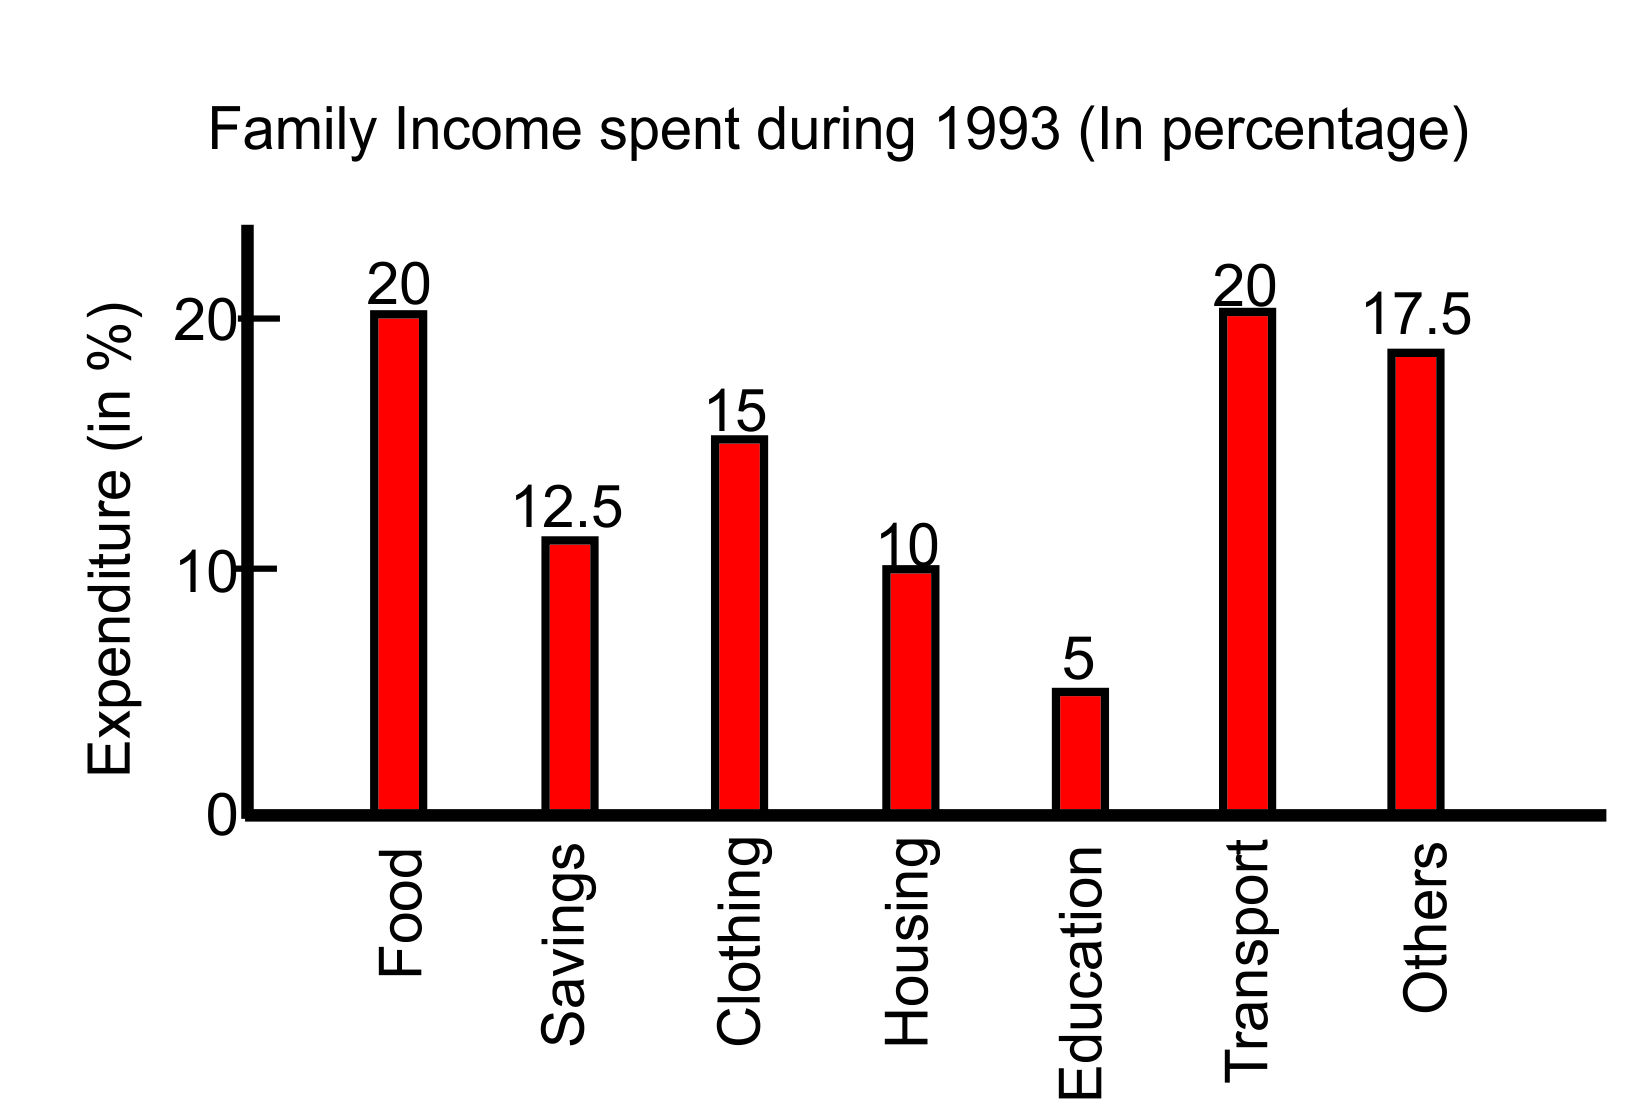
The percent of income spent on food is:
1603 05def3b1b5b0f1b05dcfc4452
5def3b1b5b0f1b05dcfc4452- 15 %false
- 210 %false
- 312.5 %false
- 420 %true
- Show AnswerHide Answer
- Workspace
- SingleChoice