Data Interpretation Questions Practice Question and Answer
8 Q:Directions : A graph showing the price of rice in India during the year 2000 to 2003 is given below. Study the graph carefully and answer the questions.

The range of price for a year is the difference between the maximum and the minimum prices for that year. The graph shows that this range of price was the greatest for the year
1605 06391d7ab58400a550dd8e020
6391d7ab58400a550dd8e020- 12000true
- 22001false
- 32002false
- 42003false
- Show AnswerHide Answer
- Workspace
- SingleChoice
Answer : 1. "2000 "
Q:Directions : A graph showing the price of rice in India during the year 2000 to 2003 is given below. Study the graph carefully and answer the questions.
For the month of May, the graph shows that the price of rice was the lowest in the year
1571 06391d74fb13d3250d3268a91
6391d74fb13d3250d3268a91- 12000false
- 22001false
- 32002false
- 42003true
- Show AnswerHide Answer
- Workspace
- SingleChoice
Answer : 4. "2003"
Q:Directions: The Pie chart given here represents the domestic expenditure of a family in per cent. Study the chart and answer the following questions if the total monthly income of the family is ₹ 33,650.
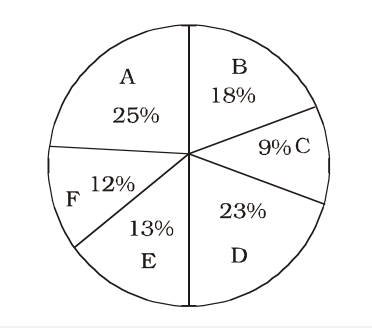
A: Expenditure on food
B: Expenditure on house-rent
C: Expenditure on entertainment
D: Expenditure on education and maintenance of children
E: Medical and miscellaneous expenditure
F: Deductions towards provident fund
Had there been no children in the family what would have been the total savings of the family including that provident fund?
1239 0638f31ecd319b37ca1826e64
638f31ecd319b37ca1826e64- 1₹ 12,667.50false
- 2₹ 12,625.50false
- 3₹ 11,727.50false
- 4₹ 11,777.50true
- Show AnswerHide Answer
- Workspace
- SingleChoice
Answer : 4. "₹ 11,777.50"
Q:Directions: The Pie chart given here represents the domestic expenditure of a family in per cent. Study the chart and answer the following questions if the total monthly income of the family is ₹ 33,650.
A: Expenditure on food
B: Expenditure on house-rent
C: Expenditure on entertainment
D: Expenditure on education and maintenance of children
E: Medical and miscellaneous expenditure
F: Deductions towards provident fund
The total amount per month, the family spends on food and entertainment combined together, is:
1084 0638f3195d319b37ca1826e42
638f3195d319b37ca1826e42- 1₹ 11,432false
- 2₹ 11,441true
- 3₹ 12,315false
- 4₹ 12,443false
- Show AnswerHide Answer
- Workspace
- SingleChoice
Answer : 2. "₹ 11,441"
Q:Directions: The Pie chart given here represents the domestic expenditure of a family in per cent. Study the chart and answer the following questions if the total monthly income of the family is ₹ 33,650.
A: Expenditure on food
B: Expenditure on house-rent
C: Expenditure on entertainment
D: Expenditure on education and maintenance of children
E: Medical and miscellaneous expenditure
F: Deductions towards provident fund
After provident fund deductions and payment of house rent, the total monthly income of the family remains
1418 0638f314f34f83f147297f7de
638f314f34f83f147297f7de- 1₹ 23,545false
- 2₹ 24,435false
- 3₹ 23,555true
- 4₹ 25, 355false
- Show AnswerHide Answer
- Workspace
- SingleChoice
Answer : 3. "₹ 23,555 "
Q:Directions: The Pie chart given here represents the domestic expenditure of a family in per cent. Study the chart and answer the following questions if the total monthly income of the family is ₹ 33,650.
A: Expenditure on food
B: Expenditure on house-rent
C: Expenditure on entertainment
D: Expenditure on education and maintenance of children
E: Medical and miscellaneous expenditure
F: Deductions towards provident fund
The annual savings in the form of provident fund would be
1290 0638f310334f83f147297f6fb
638f310334f83f147297f6fb- 1₹ 48,456true
- 2₹ 48,540false
- 3₹ 44,856false
- 4₹ 45,480false
- Show AnswerHide Answer
- Workspace
- SingleChoice
Answer : 1. "₹ 48,456 "
Q:Directions: The Pie chart given here represents the domestic expenditure of a family in per cent. Study the chart and answer the following questions if the total monthly income of the family is ₹ 33,650.
A: Expenditure on food
B: Expenditure on house-rent
C: Expenditure on entertainment
D: Expenditure on education and maintenance of children
E: Medical and miscellaneous expenditure
F: Deductions towards provident fund
The house rent per month is :
1518 0638f3083d319b37ca1826ab7
638f3083d319b37ca1826ab7- 1₹ 6000false
- 2₹ 6152false
- 3₹ 6057true
- 4₹ 6048false
- Show AnswerHide Answer
- Workspace
- SingleChoice
Answer : 3. "₹ 6057 "
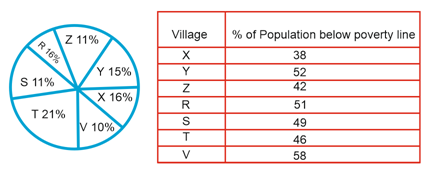
Q: Direction: The following pie chart shows proportion of the population of seven villages n 2009. Study the pie chart and answer question that follows:
If the population of village ‘R’ is 32000, then the below poverty line population of village ‘Y’ is
2216 05d7f28b67f06bc6981e06ecc
5d7f28b67f06bc6981e06eccIf the population of village ‘R’ is 32000, then the below poverty line population of village ‘Y’ is
- 114100false
- 215600true
- 316500false
- 417000false
- Show AnswerHide Answer
- Workspace
- SingleChoice