Data Interpretation Questions Practice Question and Answer
8 Q:Direction: Study the following table carefully to answer these questions.
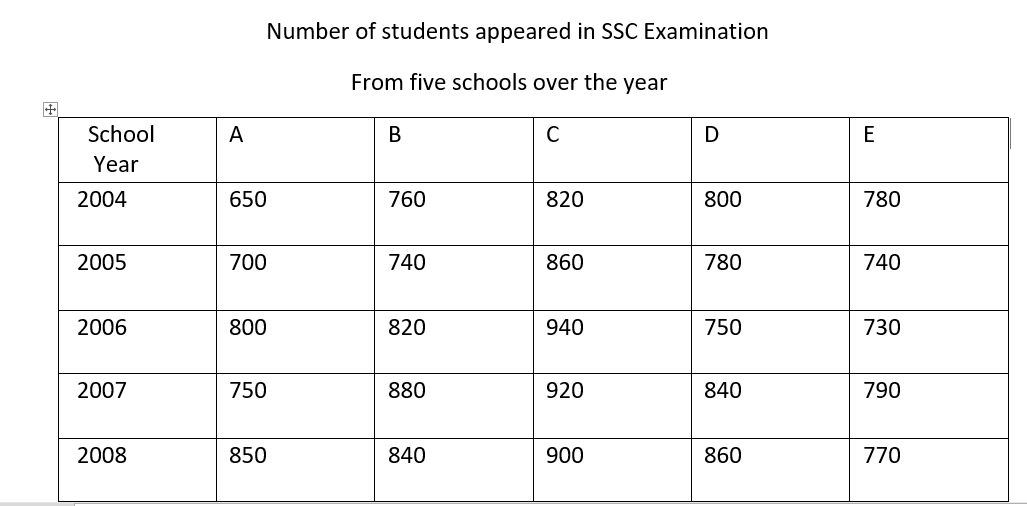
Number of students appeared in 2006 from school A is what per cent of the total number of students appeared from school A for all the years together ?
1562 05e6c689b0b8b1e6afc2ad1a0
5e6c689b0b8b1e6afc2ad1a0- 1$$ 223{2 \over3}$$false
- 2$$ 22{1 \over3}$$false
- 3$$ 22{2 \over3}$$false
- 4$$ 21{1 \over3}$$true
- 5None of thesefalse
- Show AnswerHide Answer
- Workspace
- SingleChoice
Answer : 4. "$$ 21{1 \over3}$$"
Q:Direction: The following diagram shows the percentage of population of Hindus, Sikhs and Muslims with respect to total population in a town during 2005 to 2008. Study the diagram and answer the questions:
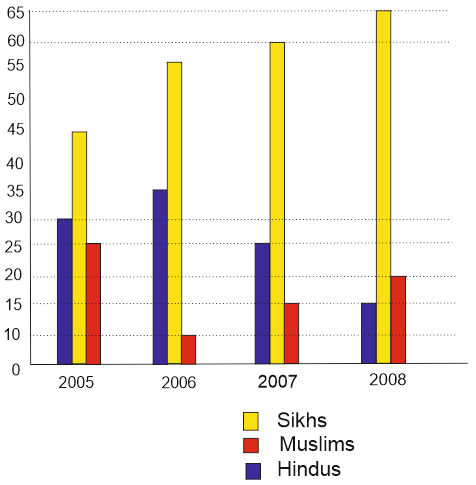
If the total population in 2007 was 80 lakh, then the number of Hindus n 2007 was (in lakh)
1556 05dccdd94b80c4d4e55b631c1
5dccdd94b80c4d4e55b631c1- 125false
- 216false
- 318false
- 420true
- Show AnswerHide Answer
- Workspace
- SingleChoice
Answer : 4. "20"
Q:Study the following bar chart and answer the questions carefully.
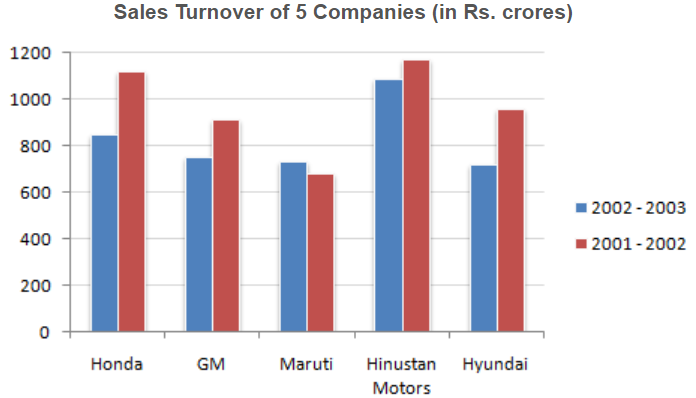
What should have been the sales turnover of GM in 2002 - 2003 to have shown an excess of the same quantum over 2001 - 2002 as shown by the sales turnover of Maruti ?
1544 05fd342d1eddcb86a7ee3e613
5fd342d1eddcb86a7ee3e613- 1953.76false
- 2963.76false
- 3952.76false
- 4962.76true
- 5None of thesefalse
- Show AnswerHide Answer
- Workspace
- SingleChoice
Answer : 4. "962.76"
Q:Study the given graph carefully to answer the questions that follow:
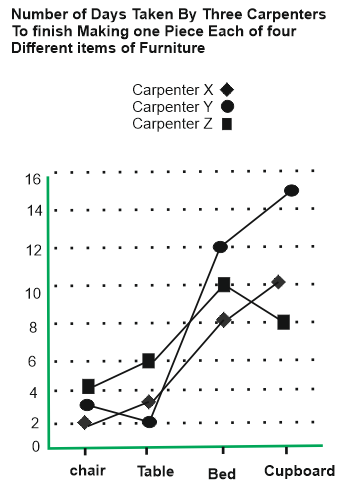
What is the total number of days that carpenter Z will take to make one piece each of all the four items together?
1543 05d85d1eaa08f7a408051bd1f
5d85d1eaa08f7a408051bd1f- 132 daystrue
- 224 daysfalse
- 318 daysfalse
- 415 daysfalse
- 5None of thesefalse
- Show AnswerHide Answer
- Workspace
- SingleChoice
Answer : 1. "32 days"
Q:Directions : Given line graph shows the data of male & female population in 5 different cities. Read the data carefully and answer the questions.
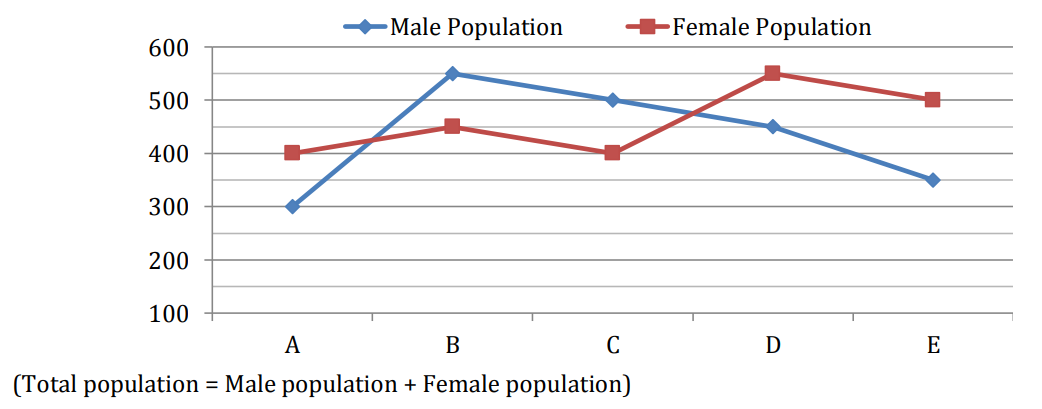
What is average of male population in all cities?
1541 06040888bb0e8d85dadab65d8
6040888bb0e8d85dadab65d8- 1465false
- 2455false
- 3440false
- 4460false
- 5430true
- Show AnswerHide Answer
- Workspace
- SingleChoice
Answer : 5. "430"
Q:Direction: The following diagram shows the percentage of population of Hindus, Sikhs and Muslims with respect to total population in a town during 2005 to 2008. Study the diagram and answer the questions:
Percentage decrease in Hindu population from 2005 to 2008 is
1540 05dccde69f348e931548efc6d
5dccde69f348e931548efc6d- 150%true
- 240 %false
- 325%false
- 415%false
- Show AnswerHide Answer
- Workspace
- SingleChoice
Answer : 1. "50%"
Q:Directions : The graph shows the demand and production of different companies. Study the graph and answer the following questions.
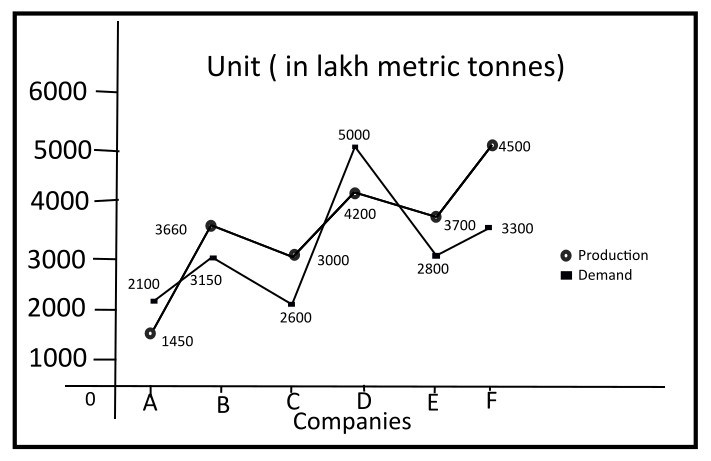
The demand of company B is what percentage of the production of company F ?
1535 05f4f72000c72eb2349336a22
5f4f72000c72eb2349336a22- 150%false
- 270%true
- 380%false
- 460%false
- Show AnswerHide Answer
- Workspace
- SingleChoice
Answer : 2. "70%"
Q:A motorist and a scooterist made a journey of 120 km at the same time and from the same place. The graph shows the progress of the journey made by each person. Study the graph and answer the questions.
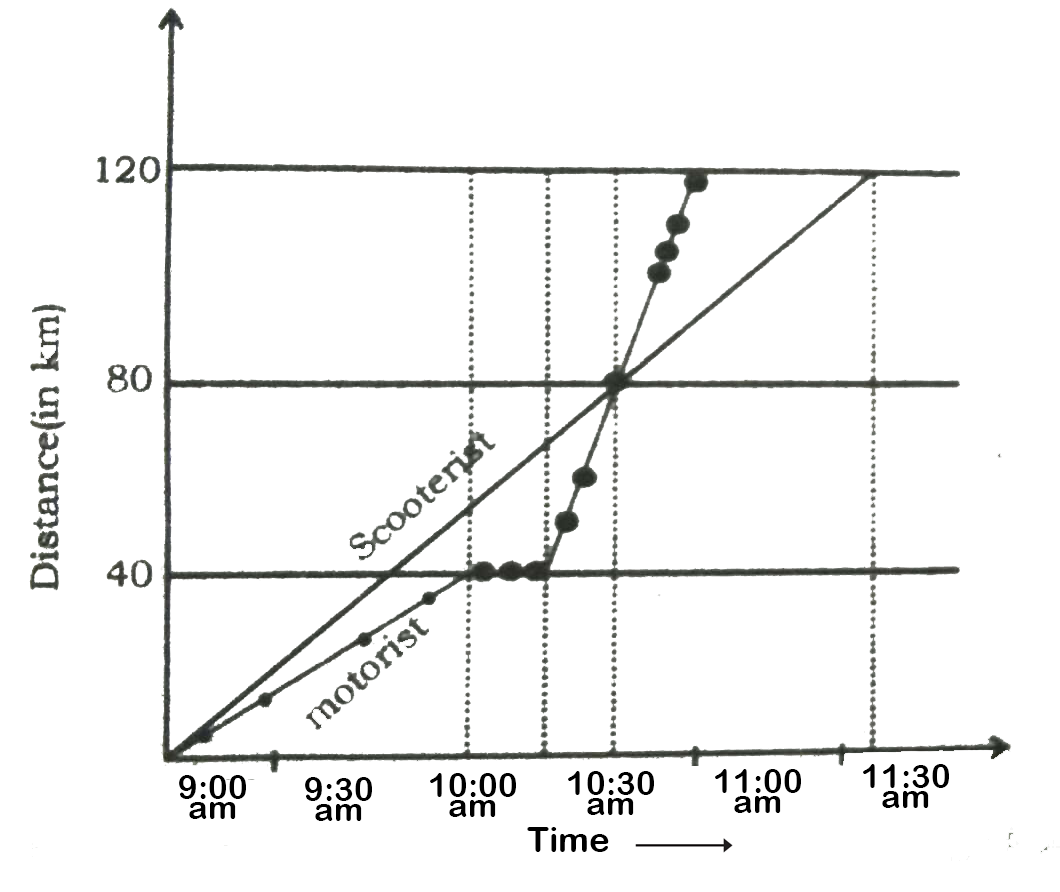
How far from the start, did the motorist meet the scooterist ? (in km )
1534 05dd67dfedb51363c023a62a0
5dd67dfedb51363c023a62a0- 175false
- 270false
- 390false
- 480true
- Show AnswerHide Answer
- Workspace
- SingleChoice