Data Interpretation Questions Practice Question and Answer
8 Q:Directions: The following graph gives Sales, Expense and Capital of a company for a period of five years 1994 to 1998. Read the graph and answer the following questions.
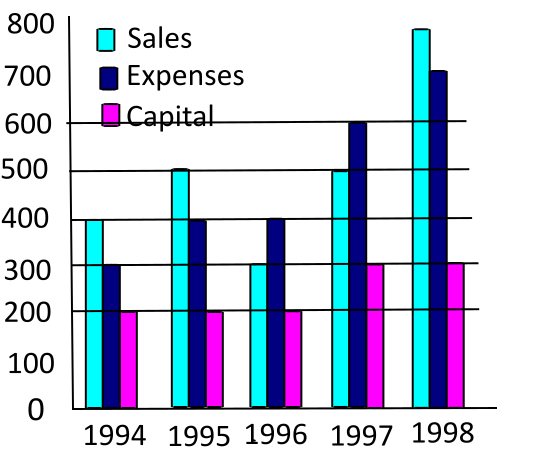
In which year was the Sales to Expense ratio the lowest?
1510 05f40e2e89b782961da3f873c
5f40e2e89b782961da3f873c- 11994false
- 21996true
- 31997false
- 41998false
- Show AnswerHide Answer
- Workspace
- SingleChoice
Answer : 2. "1996"
Q:Direction: Percentage of different types of employees in a company in two consecutive years.
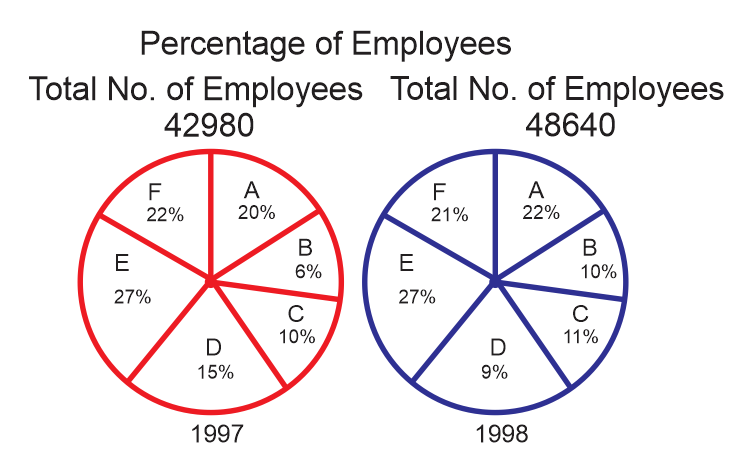
From 1997 to 1998 in the case of which of the following types of employees the change was maximum ?
1509 05e3274b41f7362736228359d
5e3274b41f7362736228359d- 1Cfalse
- 2Dfalse
- 3Btrue
- 4Afalse
- Show AnswerHide Answer
- Workspace
- SingleChoice
Answer : 3. "B"
Q:The following table shows the number of units of product produced and sold by a company during six years.
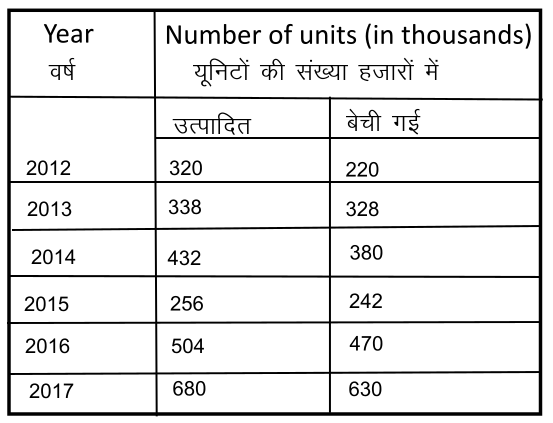
Find the ratio of the total number of units sold in 2013 and 2015 to the number of units sold in 2015 and 2016?
1503 05f6d9ac55256e8407c2dd134
5f6d9ac55256e8407c2dd134- 129 : 38false
- 214 : 19false
- 33 : 4true
- 47 : 9false
- Show AnswerHide Answer
- Workspace
- SingleChoice
Answer : 3. "3 : 4"
Q:Directions : The graph shows the demand and production of different companies. Study the graph and answer the following questions.
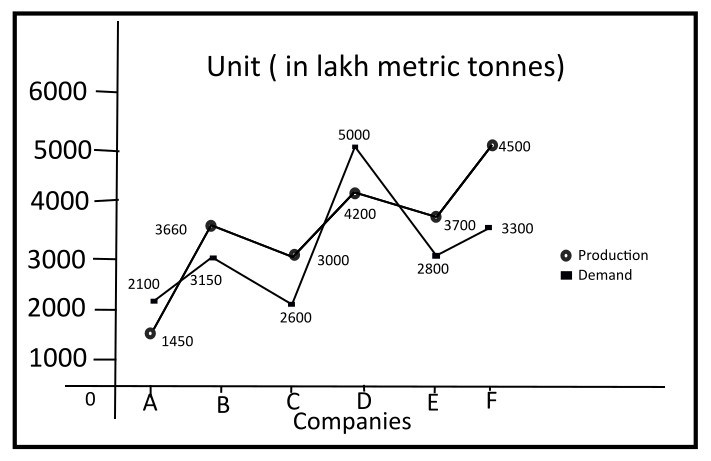
What is the ratio of companies with high demand to production and companies with less than production?
1500 05f4f71b87e85226ee74c45d7
5f4f71b87e85226ee74c45d7- 11:2true
- 22:3false
- 32:1false
- 43:2false
- Show AnswerHide Answer
- Workspace
- SingleChoice
Answer : 1. "1:2"
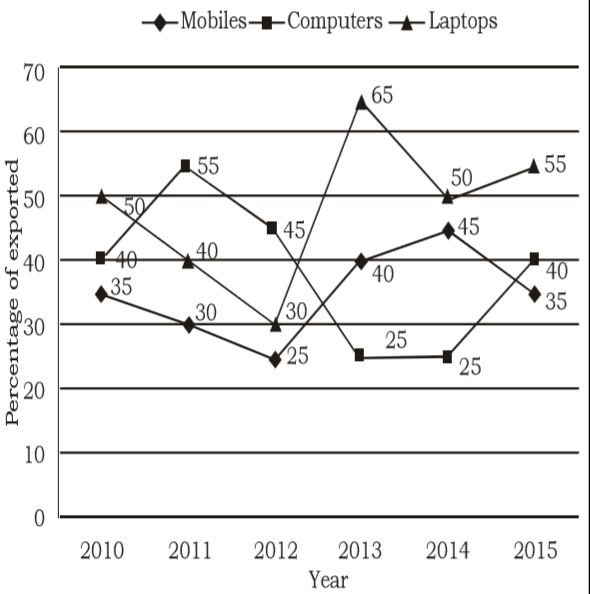
Q:Direction: Study the line graph carefully to answer the following questions.
Line graph shows the production (in thousand units) and percentage of exported mobiles, computers and laptops.
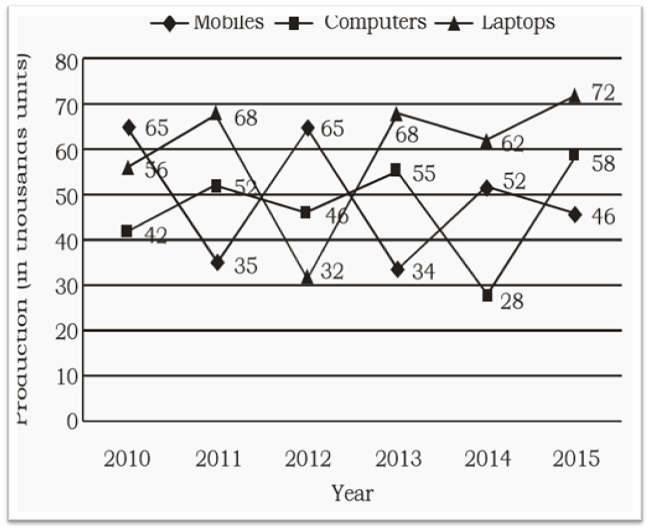
In which of the following years was the production of Laptops exactly 40% of the total production of Mobiles, Computers and Laptops in that year?
1498 05e9d2213bf0a265d837b9c2c
5e9d2213bf0a265d837b9c2cLine graph shows the production (in thousand units) and percentage of exported mobiles, computers and laptops.
- 12011false
- 22012false
- 32015false
- 42014false
- 5None of thesetrue
- Show AnswerHide Answer
- Workspace
- SingleChoice
Answer : 5. "None of these "
Q:Study the following table and answer the equation:
Number of cars sold by dealers A, B, C, D and E during first six
months of 2018.
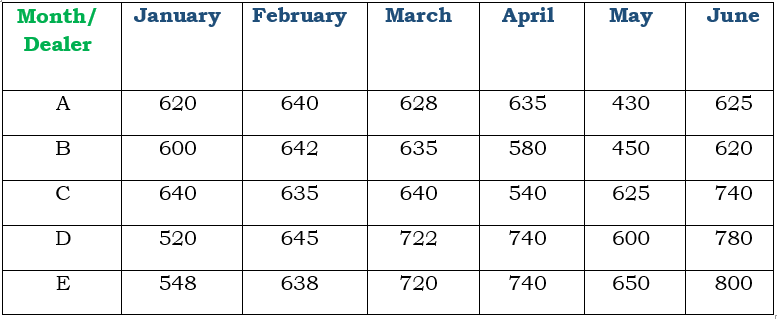
In July 2018, if the sales of cars by the dealer D increases by the same percentage as in June 2018 over its previous month, then what is the number of cars sold by D in July 2018 ?
1489 0619e09272f80a134c81c10c4
619e09272f80a134c81c10c4Number of cars sold by dealers A, B, C, D and E during first six months of 2018.
- 11014true
- 2975false
- 31020false
- 4959false
- Show AnswerHide Answer
- Workspace
- SingleChoice
Answer : 1. "1014 "
Q:Direction: The following diagram shows the percentage of population of Hindus, Sikhs and Muslims with respect to total population in a town during 2005 to 2008. Study the diagram and answer the questions:
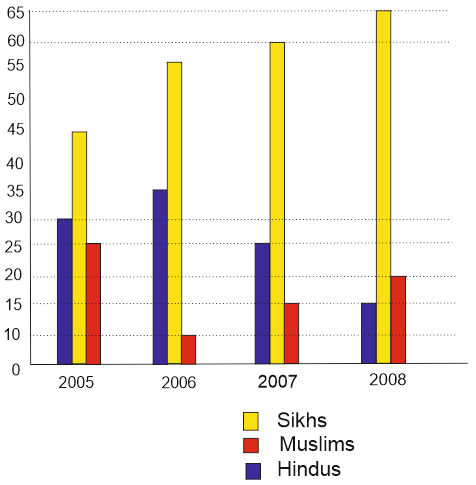
If the total number of Hindus in 2008 was 12 lakh, the number of Muslim in 2008 was (in lakh)
1485 05dccdfc6ef0a14548c1d6084
5dccdfc6ef0a14548c1d6084- 118false
- 212false
- 324false
- 416true
- Show AnswerHide Answer
- Workspace
- SingleChoice
Answer : 4. "16"
Q:Study the graph carefully and answer the following questions.
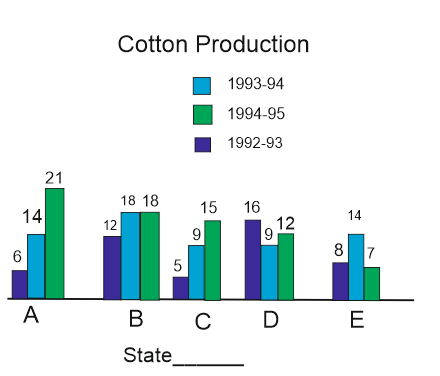
What is the average production of State C for three years?
1483 05f15660bcf79540a75340cbf
5f15660bcf79540a75340cbf- 19.33false
- 29.66true
- 38.33false
- 48.66false
- Show AnswerHide Answer
- Workspace
- SingleChoice