Data Interpretation Questions Practice Question and Answer
8 Q:Direction: Study the following table carefully and answer the given questions. Table shows the of passed students in four schools and ratio between passed boys and girls among them. The ratio between failed boys and girls is reverse of passed ratio between them.
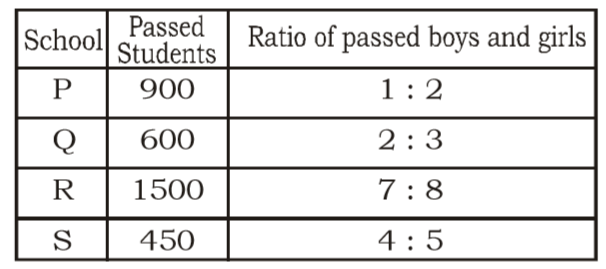
If in school P, 100 girls are failed in the exam, then find the total number of students in school P.
1479 05e9d319c0a165a45b758541d
5e9d319c0a165a45b758541d- 11,100false
- 21,300false
- 31,200true
- 41,400false
- 51,500false
- Show AnswerHide Answer
- Workspace
- SingleChoice
Answer : 3. "1,200"
Q:Directions: Read the following table and answer the questions below it:
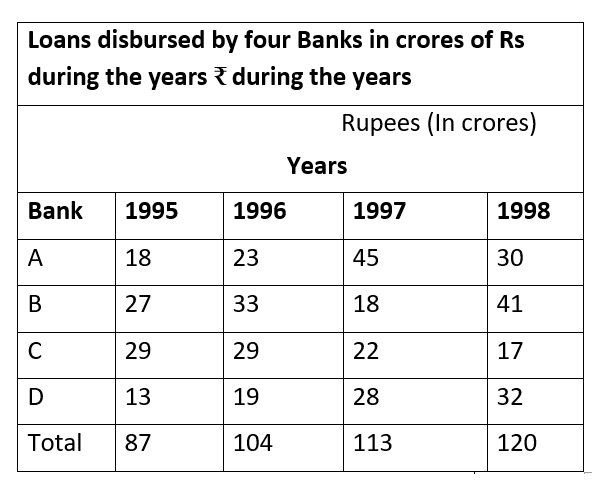
In which year was the total disbursement of loans of banks A and B exactly equal to the total disbursement of loans of banks C and D ?
1479 05e4e4ee3244a804939218ff3
5e4e4ee3244a804939218ff3- 11995false
- 21996false
- 31998false
- 4None of thesetrue
- Show AnswerHide Answer
- Workspace
- SingleChoice
Answer : 4. "None of these "
Q:Direction: Study the following graph carefully and answer the following questions.
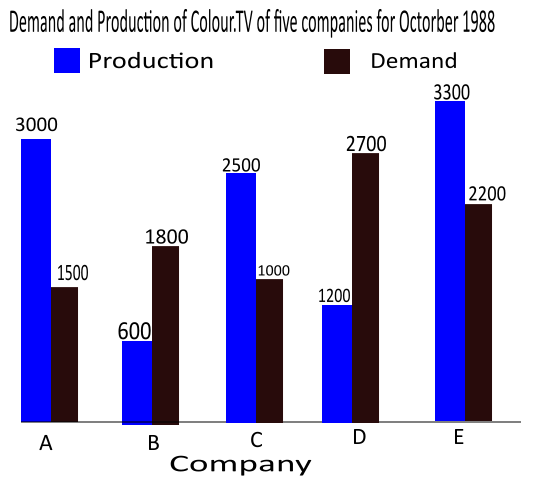
What is the difference between average demand and average production of the five companies taken together?
1478 060069d987a0c6e1017e04e41
60069d987a0c6e1017e04e41- 1400false
- 2138false
- 31400false
- 4280true
- Show AnswerHide Answer
- Workspace
- SingleChoice
Answer : 4. "280"
Q:Pie chart shows the percent of money spent by family on various item during 1999. Study the graph and answer these questions.
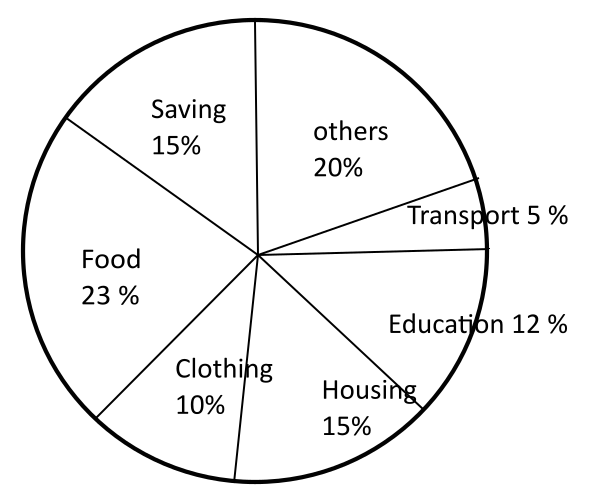
The ratio of the total amount of money spent on housing to that spent on education was
1476 05fb4e543bf36696eb8268137
5fb4e543bf36696eb8268137- 15:2false
- 22:5false
- 34:5false
- 45:4true
- Show AnswerHide Answer
- Workspace
- SingleChoice
Answer : 4. " 5:4"
Q:The given pie chart shows the percentage of students enrolled for the courses A, B, C, D and E in a university and the table shows the percentage of students that passed, out of the enrolled students.
Total Students=60,000
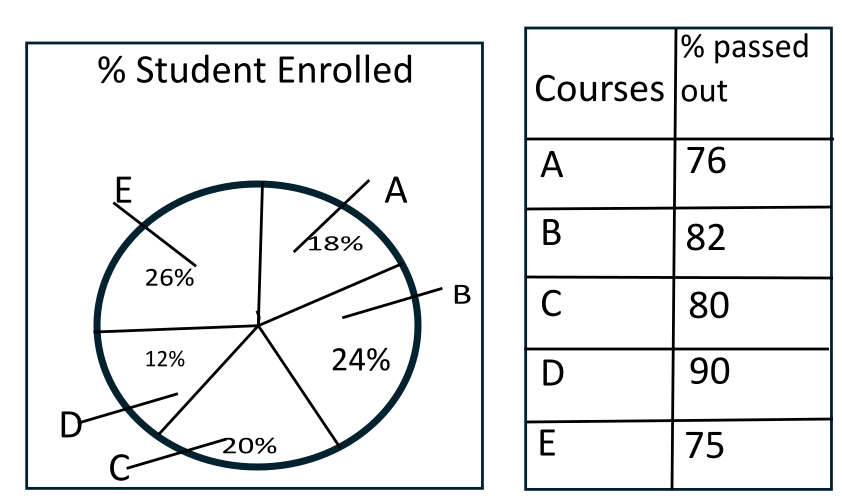
How many students passed in Course B?
1474 05ffc353523210f22f330372a
5ffc353523210f22f330372aTotal Students=60,000
- 12512false
- 22490true
- 32392false
- 42592false
- Show AnswerHide Answer
- Workspace
- SingleChoice
Answer : 2. "2490"
Q:Directions: The following graph gives Sales, Expense and Capital of a company for a period of five years 1994 to 1998. Read the graph and answer the following questions.
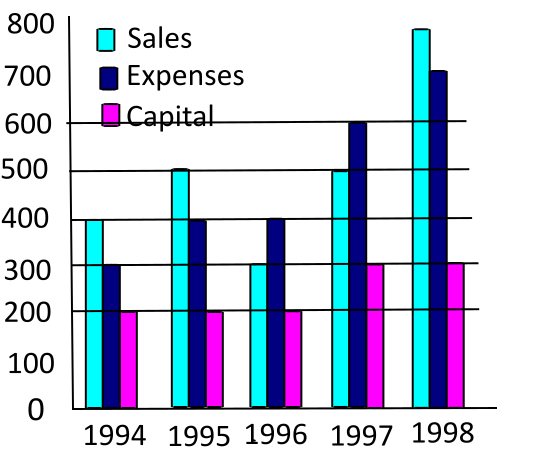
In which year was the ratio of sales to capital the lowest?
1472 05f40e6549b782961da3f964a
5f40e6549b782961da3f964a- 11998false
- 21997false
- 31996true
- 41995false
- Show AnswerHide Answer
- Workspace
- SingleChoice
Answer : 3. "1996"
Q:Directions :- Refer the graph and answer the given questions.
The following line graph shows the number of products sold by company A and B during six years.
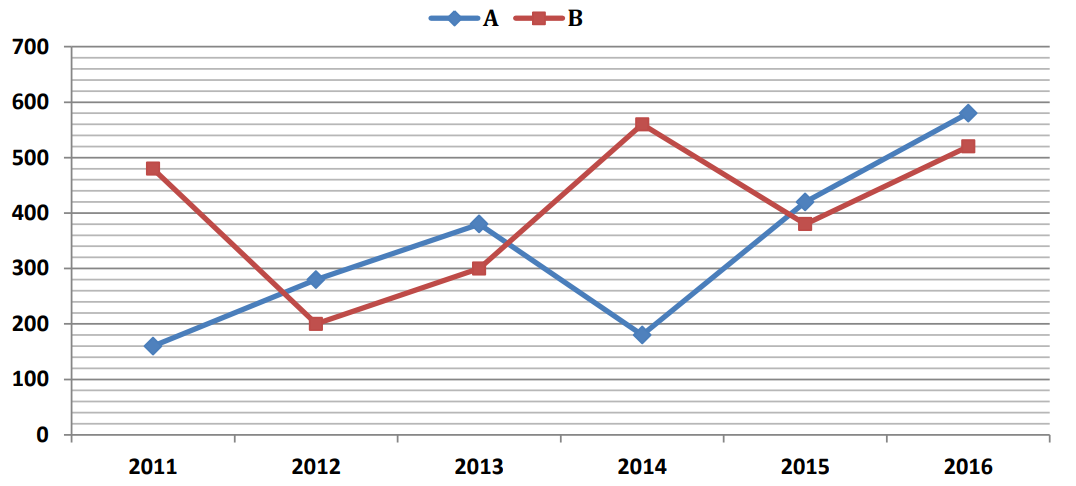
What is the ratio of the total number of products sold by A and B together in 2012 to the total number of products sold in these two companies together in 2015 ?
1471 05fd32c9ac46a213fc5c46b19
5fd32c9ac46a213fc5c46b19The following line graph shows the number of products sold by company A and B during six years.
- 112 : 25false
- 23 : 5true
- 34 : 3false
- 45 : 3false
- 5None of thesefalse
- Show AnswerHide Answer
- Workspace
- SingleChoice
Answer : 2. "3 : 5"
Q:Directions: The following bar graph shows the percentage breakup of a Sunil’s salary from year 2012 to 2016. With the given information, find the following questions.
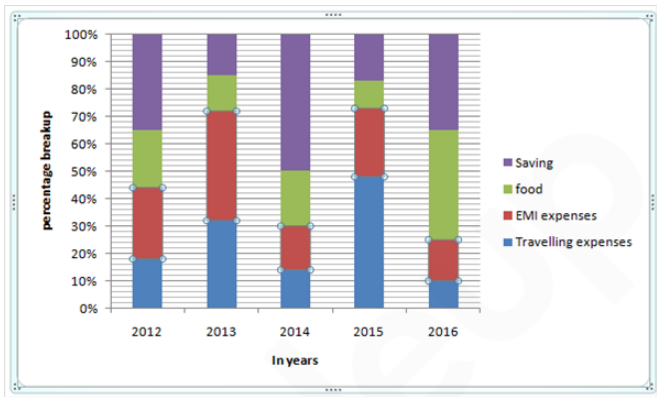
What approx. percentage of average money spend by Sunil on food to that of average money saved by him during all these years if his salary per annum was ₹ 5,00,000
1470 060a23d0a3c86b05632619055
60a23d0a3c86b05632619055- 169%false
- 266%false
- 365%false
- 470%false
- 568%true
- Show AnswerHide Answer
- Workspace
- SingleChoice