Data Interpretation Questions Practice Question and Answer
8 Q:Study the following table and answer the equation:
Number of cars sold by dealers A, B, C, D and E during first six
months of 2018.
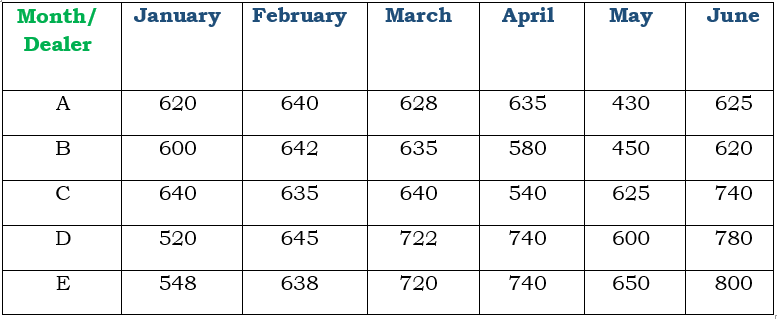
The ratio of the total number of cars sold by dealer B in January, April and June to the total number of cars sold by dealers A and D in March is:
1462 0619e08c6925df30febf07d0e
619e08c6925df30febf07d0eNumber of cars sold by dealers A, B, C, D and E during first six months of 2018.
- 18:9false
- 27:5false
- 34:3true
- 410:9false
- Show AnswerHide Answer
- Workspace
- SingleChoice
Answer : 3. "4:3 "
Q:Directions: The bar graph shows the results of an annual examination in a secondary school in a certain year. Answer the following four questions based on this chart.

The class in which the number of boys passed is nearest to the average number of girls passed per class, is
1459 05e8af9a67b82aa7479fc1c80
5e8af9a67b82aa7479fc1c80- 1VIIIfalse
- 2IXfalse
- 3Xfalse
- 4VItrue
- Show AnswerHide Answer
- Workspace
- SingleChoice
Answer : 4. "VI "
Q:Direction: Study the following table carefully to answer these questions.
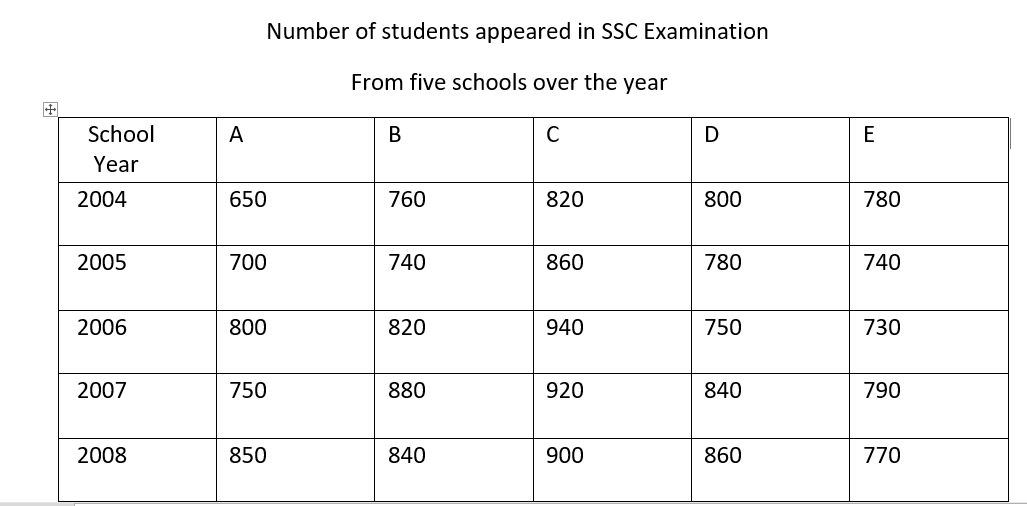
What is the ratio between the total number of students appeared in 2004 and 2005 together from' schools C and D respectively?
1458 05e6c6ae78fcee56af2057089
5e6c6ae78fcee56af2057089- 184:79true
- 279:84false
- 348 :79false
- 479:48false
- 5None of thesefalse
- Show AnswerHide Answer
- Workspace
- SingleChoice
Answer : 1. "84:79"
Q:Study the following graph carefully to answer the given questions
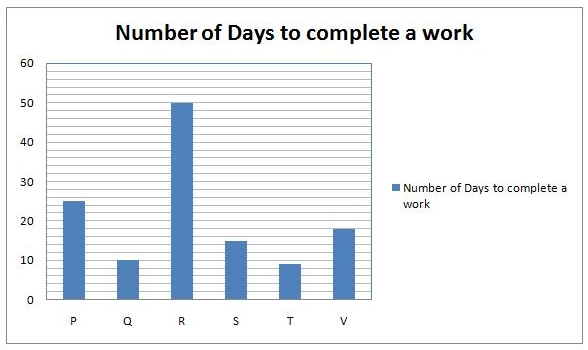
The efficiency of L is 25% more than P. L started a work alone and then P joined her 5 days before actual completion of the work. For how many days L worked alone?
1456 05ea9405b07542b13ae2c1662
5ea9405b07542b13ae2c1662- 19false
- 211true
- 310false
- 425false
- 512false
- Show AnswerHide Answer
- Workspace
- SingleChoice
Answer : 2. "11"
Q:Study the following bar chart and answer the questions carefully.
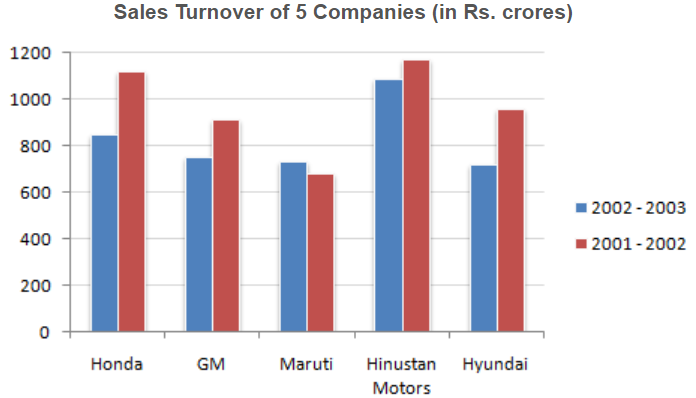
Which of the companies shows the maximum percentage difference in sales turnover between the two years ?
1456 05fd33b8ec46a213fc5c4fe25
5fd33b8ec46a213fc5c4fe25- 1Hondafalse
- 2GMfalse
- 3Hyundaitrue
- 4Marutifalse
- 5None of thesefalse
- Show AnswerHide Answer
- Workspace
- SingleChoice
Answer : 3. "Hyundai"
Q:Directions: The following table represents the percentage marks of four students in six subjects.
Consider the table and answer questions based on it
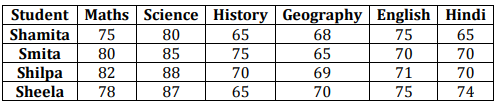
Average marks obtained in Science is higher than that of Maths by
1455 0607959b763b9781494e885d5
607959b763b9781494e885d5Consider the table and answer questions based on it
- 11.5false
- 220false
- 36.25true
- 440false
- Show AnswerHide Answer
- Workspace
- SingleChoice
Answer : 3. "6.25"
Q:Directions: The bar chart given below shows the percentage distribution of the production of various models of a mobile manufacturing company in 2007 and 2008. The total production in 2007 was 35 lakh mobile phones and in 2008 the production was 44 lakh. Study the chart and answer the following questions.
Percentage of six different types of mobiles manufactured by a company over two year
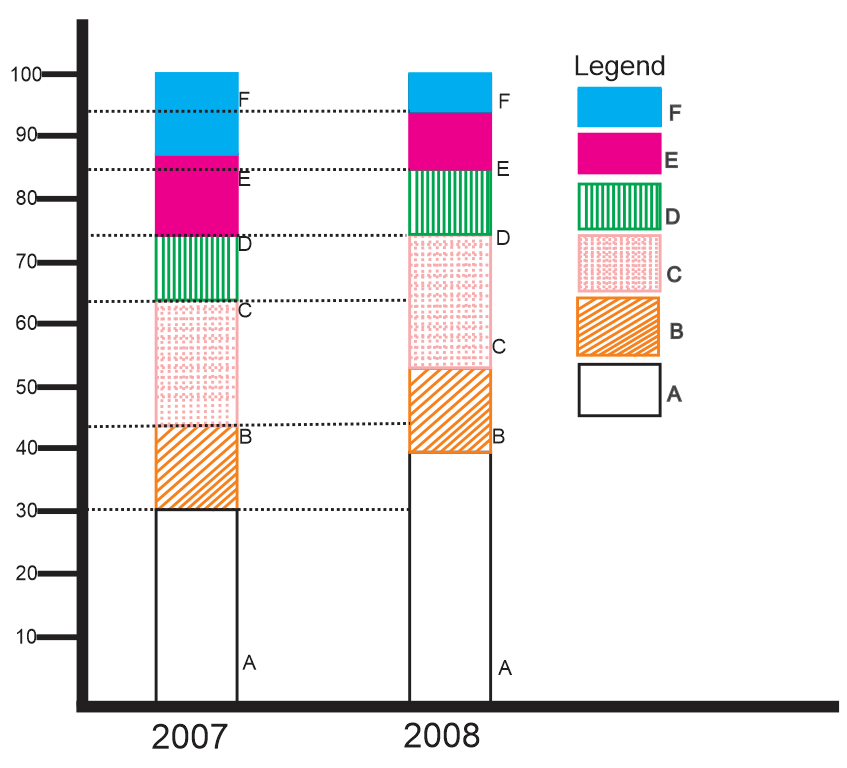
What was the difference in the number of B type mobiles produced in 2007 and 2008?
1449 05dd68408db51363c023a73a0
5dd68408db51363c023a73a0Percentage of six different types of mobiles manufactured by a company over two year
- 13,55,000true
- 22,70,000false
- 32,25,000false
- 41,75,000false
- Show AnswerHide Answer
- Workspace
- SingleChoice
Answer : 1. "3,55,000 "
Q:The given pie chart shows the percentage of students enrolled for the courses A, B, C, D and E in a university and the table shows the percentage of students that passed, out of the enrolled students.
Total Students=60,000
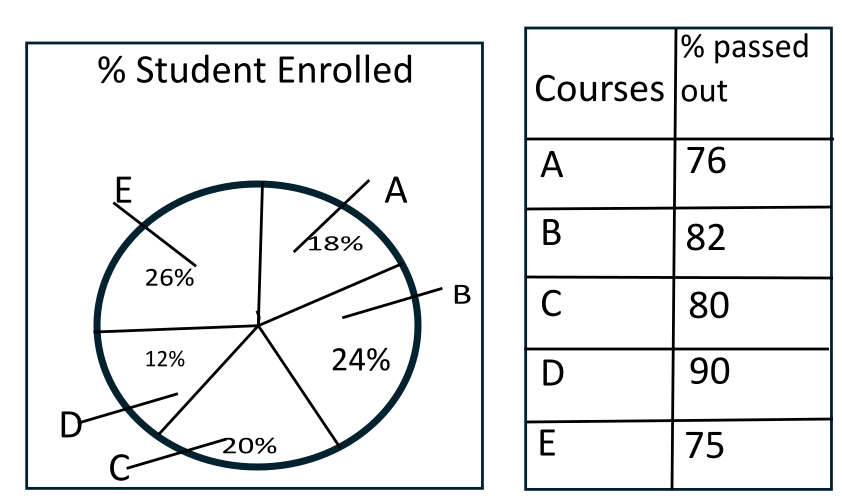
If the total number of students is 60,000, then the total number of students who did not pass in the course A, C is:
1448 05ffc34c3b78a0253d6ee6529
5ffc34c3b78a0253d6ee6529Total Students=60,000
- 17628false
- 24992true
- 38253false
- 47852false
- Show AnswerHide Answer
- Workspace
- SingleChoice