Data Interpretation Questions Practice Question and Answer
8 Q:Directions: The following bar graph shows the percentage breakup of a Sunil’s salary from year 2012 to 2016. With the given information, find the following questions.
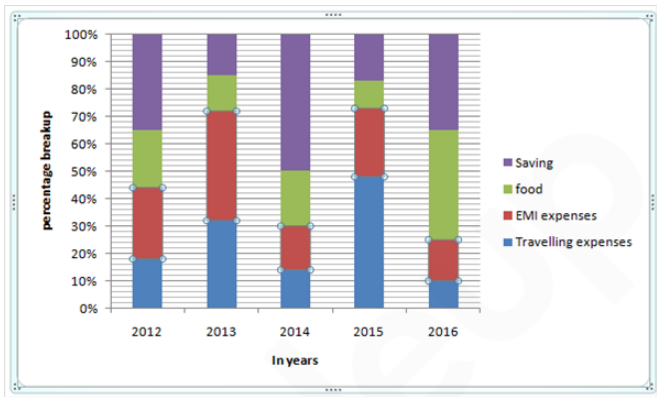
If the total expenses in year 2011 is ₹ 3, 00,000 and there is an increase of 18% in 2012. Then how much Sunil has spent on travelling and EMI combine in 2012?
1430 060a23c70b1d2440614b98b90
60a23c70b1d2440614b98b90- 1₹ 92,400false
- 2₹ 1,55,760true
- 3₹ 1,53,740false
- 4₹ 1,40,330false
- 5₹ 1,50,740false
- Show AnswerHide Answer
- Workspace
- SingleChoice
Answer : 2. "₹ 1,55,760"
Q:Directions: Study the bar-graph given below & answer the questions.
Pie-chart given below shows the percentage distribution of total no. of boys in six different Schools.
Total Boys in all schools together = 6400
If the ratio boys to girls in School A and School B is 2 : 3 and 3 : 7 respectively. Then find the difference of total girls in school B and A?
1428 05e93dd248e9fdd3c20478683
5e93dd248e9fdd3c20478683Pie-chart given below shows the percentage distribution of total no. of boys in six different Schools.
Total Boys in all schools together = 6400
- 11020false
- 2None of thesefalse
- 31160false
- 41280true
- 51240false
- Show AnswerHide Answer
- Workspace
- SingleChoice
Answer : 4. "1280"
Q:The following table shows the number of units of product produced and sold by a company over the course of six years.
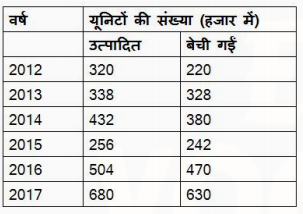
In which year, the production of product units is about 31.4 percent less than the units sold in 2017?
1426 0602e07116d461f66398731a1
602e07116d461f66398731a1- 12012false
- 22016false
- 32014true
- 42013false
- Show AnswerHide Answer
- Workspace
- SingleChoice
Answer : 3. "2014"
Q:Direction: Study the following information and answer the related questions. P, Q, R, S, T, A, B, C, D and E are employees of a company. A table shows the average age of any two employees of the company. The average age of A and B is 27.5.
i.e. average age of A & P is given as (A+P)/2=39.5
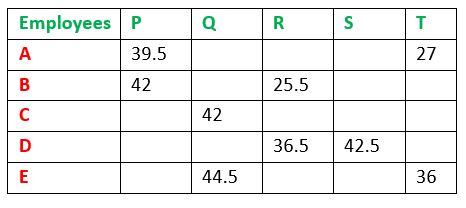
What is the age of T?
1425 06062bb4b9cf7d827dcdcde5b
6062bb4b9cf7d827dcdcde5bi.e. average age of A & P is given as (A+P)/2=39.5
- 133false
- 239false
- 327false
- 429true
- 5None of thesefalse
- Show AnswerHide Answer
- Workspace
- SingleChoice
Answer : 4. "29 "
Q:Direction: Study the following information and answer the related questions. P, Q, R, S, T, A, B, C, D and E are employees of a company. A table shows the average age of any two employees of the company. The average age of A and B is 27.5.
i.e. average age of A & P is given as (A+P)/2=39.5
What is the average age of D, R and S?
1424 06062bbc49cf7d827dcdce208
6062bbc49cf7d827dcdce208i.e. average age of A & P is given as (A+P)/2=39.5
- 132false
- 235.6false
- 325false
- 431false
- 5None of thesetrue
- Show AnswerHide Answer
- Workspace
- SingleChoice
Answer : 5. "None of these"
Q: The table given below shows the cost price and selling price of four articles.
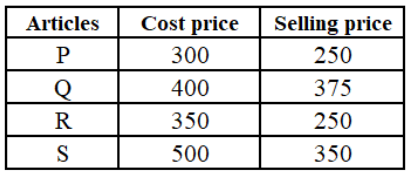
What is the average value of loss of all articles?
1423 06450b2a7f3618908bf57165d
6450b2a7f3618908bf57165d- 160.75false
- 295.55false
- 381.25true
- 472.24false
- Show AnswerHide Answer
- Workspace
- SingleChoice
Answer : 3. "81.25 "
Q:Directions: Following is the pie-chart showing the spending of a family on various items in a particular year
Study the pie chart and answer questions
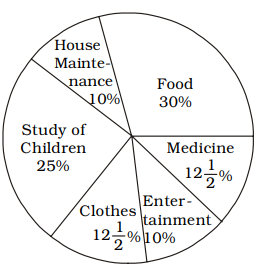
If the difference in the amount spent for buying clothes and house maintenance was ₹ 1,500, how much they spent for house maintenance?
1422 063be706261d62119f1dbc6fa
63be706261d62119f1dbc6fa- 1₹ 5,000false
- 2₹ 6,000true
- 3₹ 7,000false
- 4₹ 8,000false
- Show AnswerHide Answer
- Workspace
- SingleChoice
Answer : 2. "₹ 6,000 "
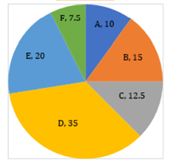
Q:Directions: The Pie chart given here represents the domestic expenditure of a family in per cent. Study the chart and answer the following questions if the total monthly income of the family is ₹ 33,650.
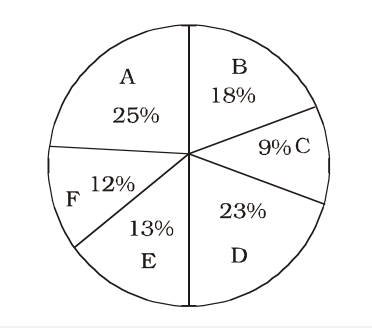
A: Expenditure on food
B: Expenditure on house-rent
C: Expenditure on entertainment
D: Expenditure on education and maintenance of children
E: Medical and miscellaneous expenditure
F: Deductions towards provident fund
After provident fund deductions and payment of house rent, the total monthly income of the family remains
1419 0638f314f34f83f147297f7de
638f314f34f83f147297f7de- 1₹ 23,545false
- 2₹ 24,435false
- 3₹ 23,555true
- 4₹ 25, 355false
- Show AnswerHide Answer
- Workspace
- SingleChoice