Data Interpretation Questions Practice Question and Answer
8 Q:A motorist and a scooterist made a journey of 120 km at the same time and from the same place. The graph shows the progress of the journey made by each person. Study the graph and answer the questions.
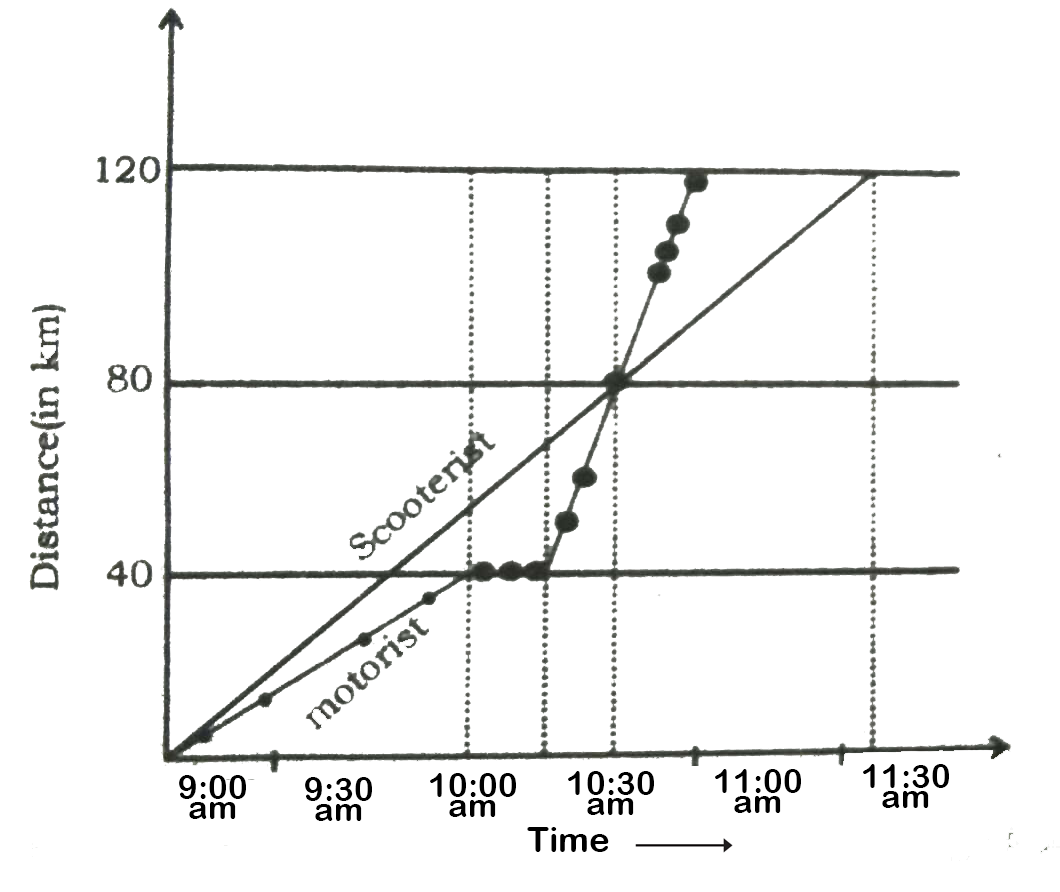
What was the speed of the scooterist during the journey? (in kmph)
1419 05dd67cecdb51363c023a5dd1
5dd67cecdb51363c023a5dd1- 145false
- 248true
- 342false
- 446false
- Show AnswerHide Answer
- Workspace
- SingleChoice
Answer : 2. "48 "
Q:The following chart depicts the percentage of Educated and Uneducated men and women in a city with a population of 2,50,000.
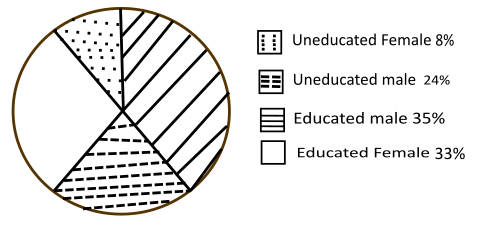
Differentiate between the number of Educated males and Educated females.
1419 05f9f9b8cd265227c88cdde25
5f9f9b8cd265227c88cdde25- 15,000true
- 2500false
- 375,000false
- 41,500false
- Show AnswerHide Answer
- Workspace
- SingleChoice
Answer : 1. "5,000"
Q:Directions: The bar graph, given here, shows the number of tickets sold by 6 students A, B, C, D, E and F during a fair.
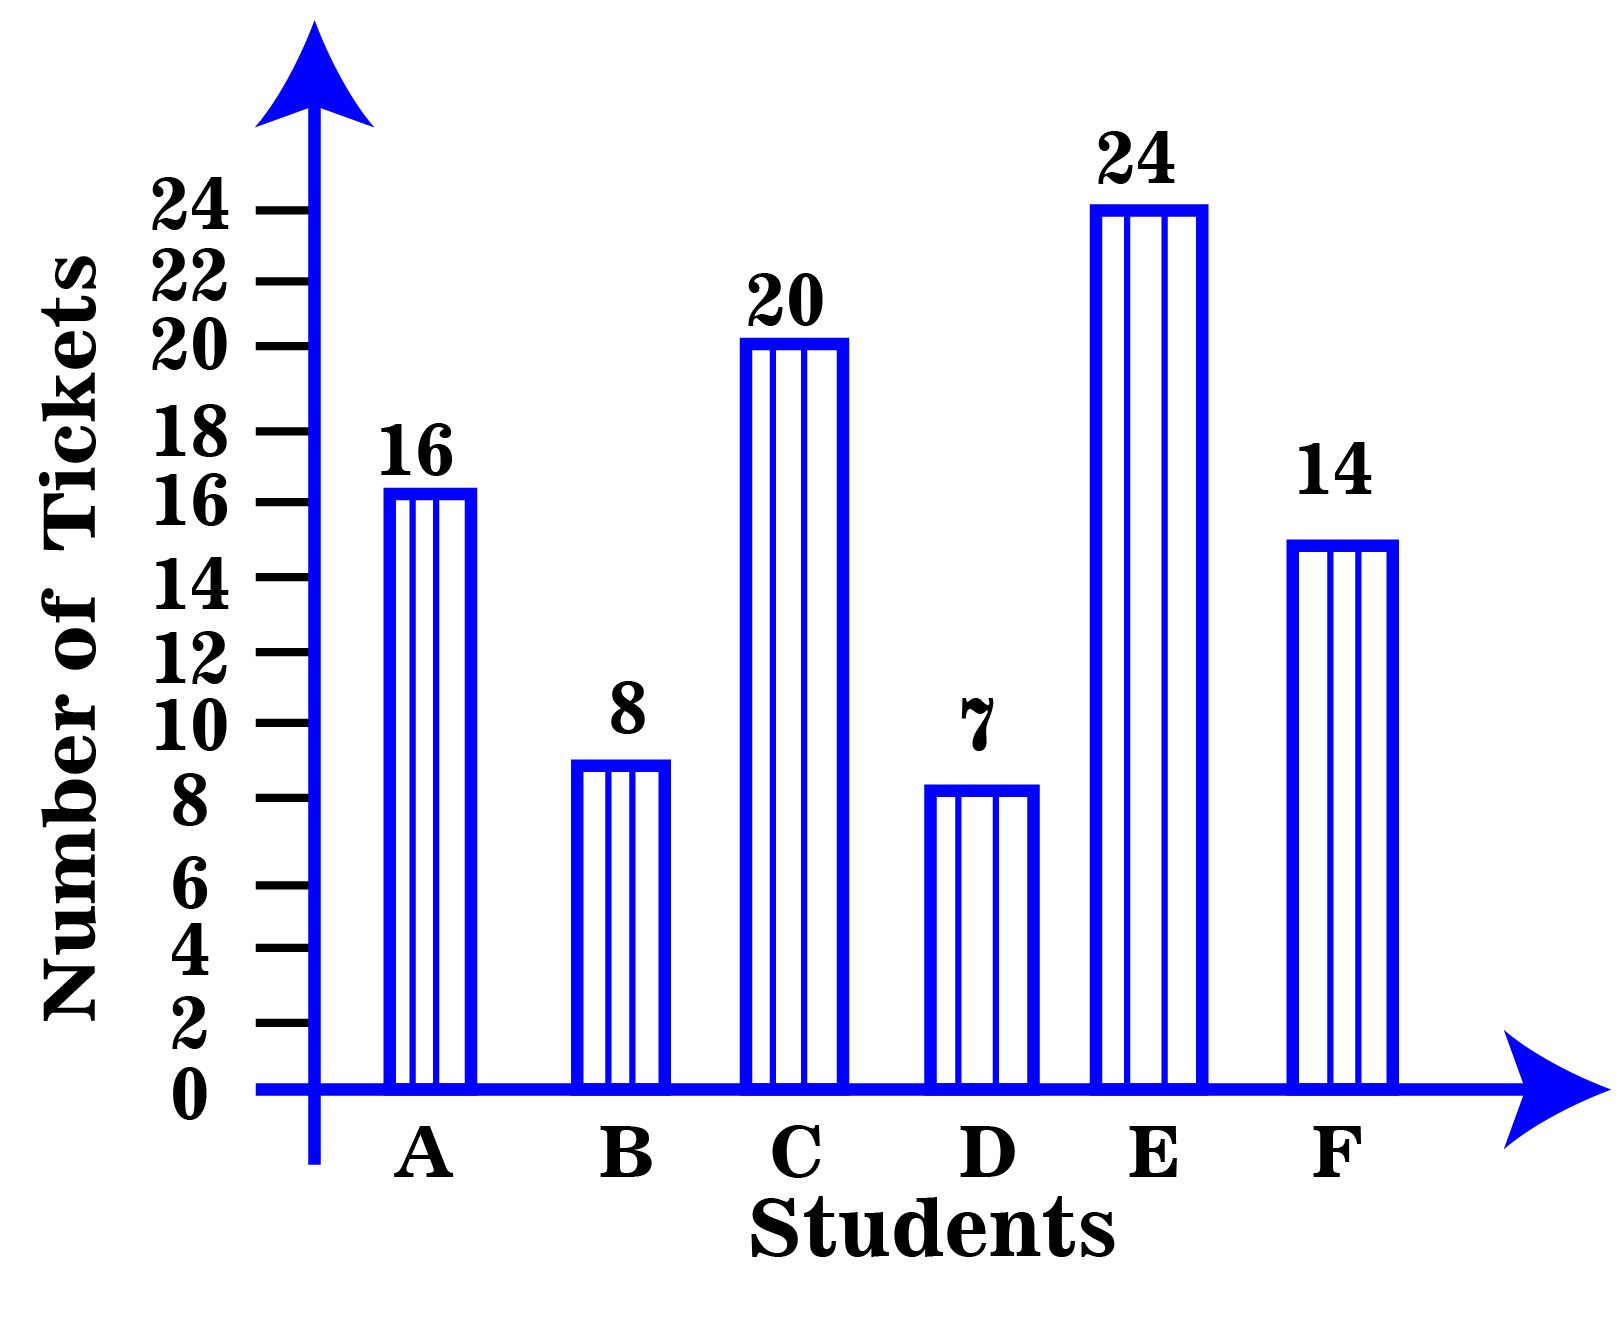
Which student sold the least tickets?
1417 05ea8144c14fb314c31fe88be
5ea8144c14fb314c31fe88be- 1Bfalse
- 2Ffalse
- 3Afalse
- 4Dtrue
- 5None of thesefalse
- Show AnswerHide Answer
- Workspace
- SingleChoice
Answer : 4. "D"
Q:Direction: Study the line graph carefully to answer the following questions.
Line graph shows the production (in thousand units) and percentage of exported mobiles, computers and laptops.
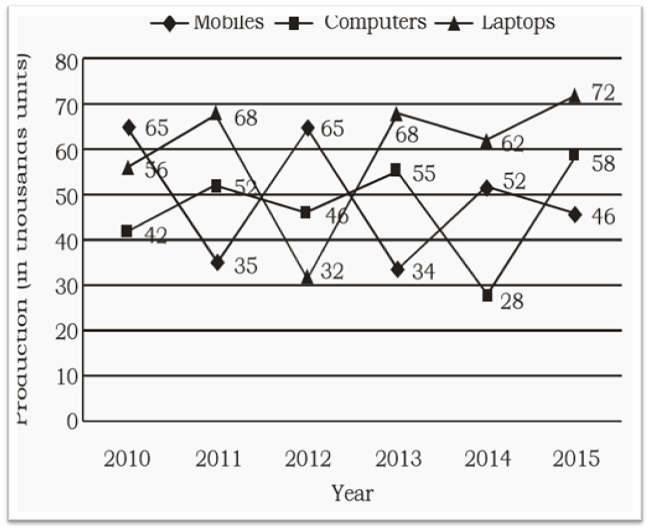
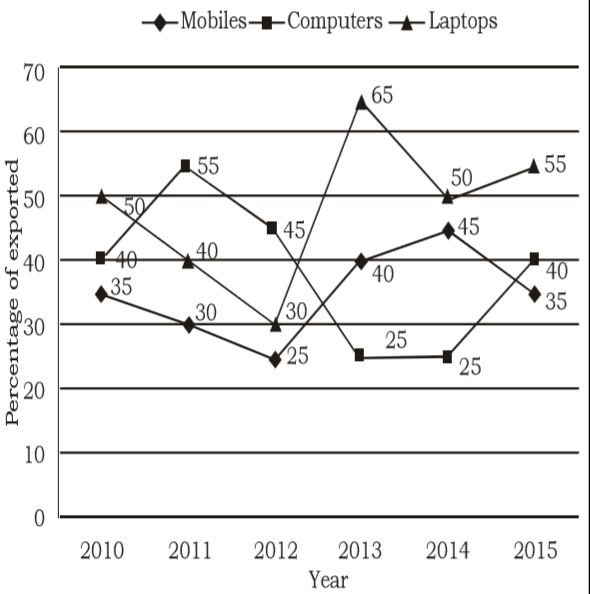
Find the ratio between Mobiles, Laptops and Computers exported in the year 2012.
1416 05e9d1e23772f97276f50a277
5e9d1e23772f97276f50a277Line graph shows the production (in thousand units) and percentage of exported mobiles, computers and laptops.
- 1325 : 316: 419false
- 2325 : 192 : 414true
- 3319 : 216:425false
- 4256 : 355 : 135false
- 5None of thesefalse
- Show AnswerHide Answer
- Workspace
- SingleChoice
Answer : 2. "325 : 192 : 414"
Q:Direction: The following table shows the number of students of 7 colleges A, B, C, D, E, F, G participating in extra-curricular activities :
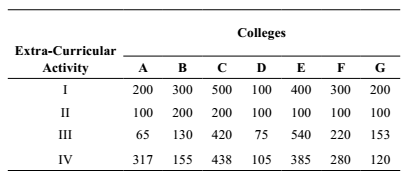
The median of data pertaining to activity III is
1415 0601146ecaf82aa3010a2f5cd
601146ecaf82aa3010a2f5cd- 1540false
- 2229false
- 3153true
- 475false
- Show AnswerHide Answer
- Workspace
- SingleChoice
Answer : 3. "153"
Q:Direction: Study the pie chart carefully and answer the given questions. The pie chart shows the percentage breakup of students in different classes from VI to X in the year 2017
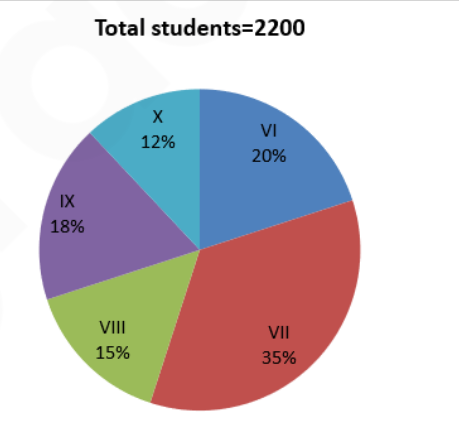
What is the difference between the total number of students in class VII and class VIII together to that of the total number of students in class IX and class X together?
1412 060a258bbde4c2e1331dbeaf6
60a258bbde4c2e1331dbeaf6- 1400false
- 2560false
- 3480false
- 4520false
- 5440true
- Show AnswerHide Answer
- Workspace
- SingleChoice
Answer : 5. "440"
Q:The following chart depicts the percentage of Educated and Uneducated men and women in a city with a population of 2,50,000.
How many of these women are Uneducated?
1412 05f9f9c064a02db7b99b229e3
5f9f9c064a02db7b99b229e3- 120,000true
- 235,000false
- 340,000false
- 425,000false
- Show AnswerHide Answer
- Workspace
- SingleChoice
Answer : 1. "20,000"
Q:Directions: The bar chart given below shows the percentage distribution of the production of various models of a mobile manufacturing company in 2007 and 2008. The total production in 2007 was 35 lakh mobile phones and in 2008 the production was 44 lakh. Study the chart and answer the following questions.
Percentage of six different types of mobiles manufactured by a company over two year
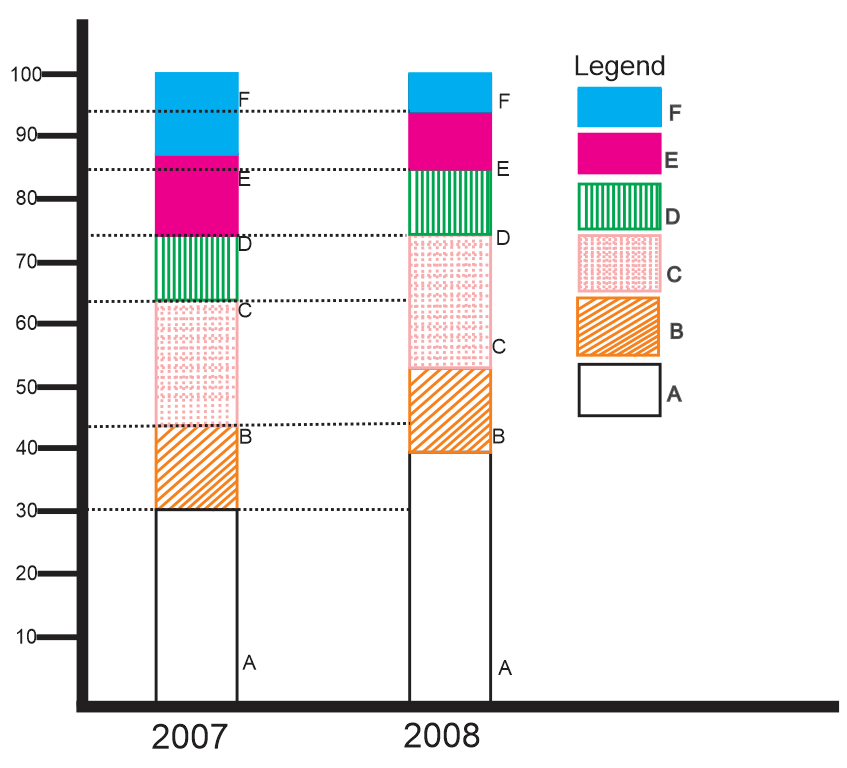
Total number of mobiles of models A, B and E manufactured in 2007 was
1411 05dd6828a00a9284b722e987b
5dd6828a00a9284b722e987bPercentage of six different types of mobiles manufactured by a company over two year
- 124,50,000false
- 222,75,00false
- 321,00,000true
- 419,25,00false
- Show AnswerHide Answer
- Workspace
- SingleChoice