Data Interpretation Questions Practice Question and Answer
8 Q:Directions: Study the following table carefully to answer the questions that follow .
Number of soldiers ( in thousands ) joining five different forces during six different.

What was the average number of soldiers joining all the forces together in the year 2007?
1120 05e82ebabd06376635697510a
5e82ebabd06376635697510aNumber of soldiers ( in thousands ) joining five different forces during six different.

- 14,620false
- 242,400false
- 34,260false
- 442,600false
- 5None of thesetrue
- Show AnswerHide Answer
- Workspace
- SingleChoice
Answer : 5. "None of these "
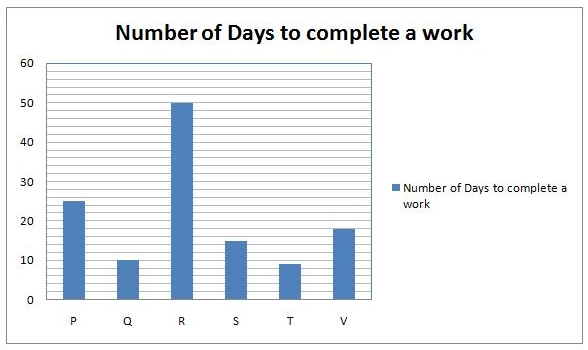
Q:Study the following graph carefully to answer the given questions

Q and S work together for 5 days, the rest of the work is finished by M in two more days. If they get Rs. 6000 as wages for the whole work, what are the daily wages of Q, S and M respectively?
1119 05ea93fce3dbbdc76195ad9b3
5ea93fce3dbbdc76195ad9b3
- 1200, 250, 300false
- 2300, 200, 250false
- 3600, 400, 200false
- 4600, 400, 500true
- 5None of thesefalse
- Show AnswerHide Answer
- Workspace
- SingleChoice
Answer : 4. "600, 400, 500"
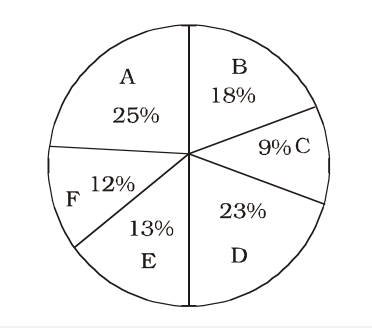
Q:Directions: The Pie chart given here represents the domestic expenditure of a family in per cent. Study the chart and answer the following questions if the total monthly income of the family is ₹ 33,650.

A: Expenditure on food
B: Expenditure on house-rent
C: Expenditure on entertainment
D: Expenditure on education and maintenance of children
E: Medical and miscellaneous expenditure
F: Deductions towards provident fund
After provident fund deductions and payment of house rent, the total monthly income of the family remains
1118 0638f314f34f83f147297f7de
638f314f34f83f147297f7de
- 1₹ 23,545false
- 2₹ 24,435false
- 3₹ 23,555true
- 4₹ 25, 355false
- Show AnswerHide Answer
- Workspace
- SingleChoice
Answer : 3. "₹ 23,555 "
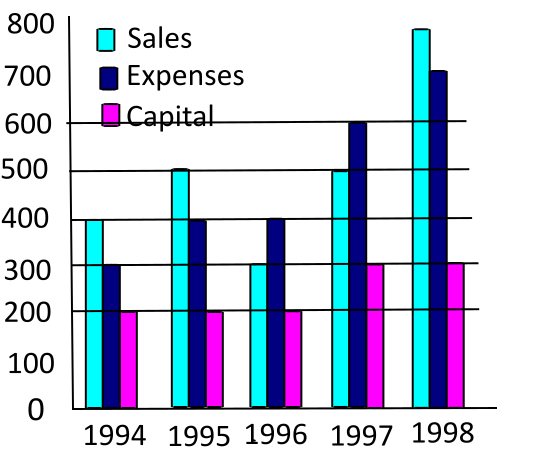
Q:Directions: The following graph gives Sales, Expense and Capital of a company for a period of five years 1994 to 1998. Read the graph and answer the following questions.

In which year was the ratio of profits to capital the highest?
1117 05f40e5d69b782961da3f9518
5f40e5d69b782961da3f9518
- 11998false
- 21995true
- 31996false
- 41997false
- Show AnswerHide Answer
- Workspace
- SingleChoice
Answer : 2. "1995"
Q:Study the following graph carefully to answer the given questions

T and V started the work. After 3 days Z joined them, who can complete alone the same whole work in 3 days. What is the total number of days in which they had completed the work?
1114 05ea94139f197950c155cbe11
5ea94139f197950c155cbe11
- 112false
- 28false
- 34true
- 46false
- 5None of thesefalse
- Show AnswerHide Answer
- Workspace
- SingleChoice
Answer : 3. "4"
Q:The table given below shows the information about bats manufactured by 6 different companies. Each company manufactures only plastic and wooden bats. Each company labels these bats as Brand A or Brand B. The table shows the number of plastic bats as a percentage of total bats manufactured by each company. It also shows the ratio of wooden bats labelled A and B. Each company manufactured a total 550000 bats.

Taking all 6 companies together, how many wooden bats of Brand A have been produced?
1112 05f30d866bcbb69394d1ca3a7
5f30d866bcbb69394d1ca3a7
- 1691000true
- 2724000false
- 3683000false
- 4716000false
- Show AnswerHide Answer
- Workspace
- SingleChoice
Answer : 1. "691000"
Q:Directions: The bar graph shows the results of an annual examination in a secondary school in a certain year. Answer the following four questions based on this chart.

The class in which the number of boys passed is nearest to the average number of girls passed per class, is
1110 05e8af9a67b82aa7479fc1c80
5e8af9a67b82aa7479fc1c80
- 1VIIIfalse
- 2IXfalse
- 3Xfalse
- 4VItrue
- Show AnswerHide Answer
- Workspace
- SingleChoice
Answer : 4. "VI "
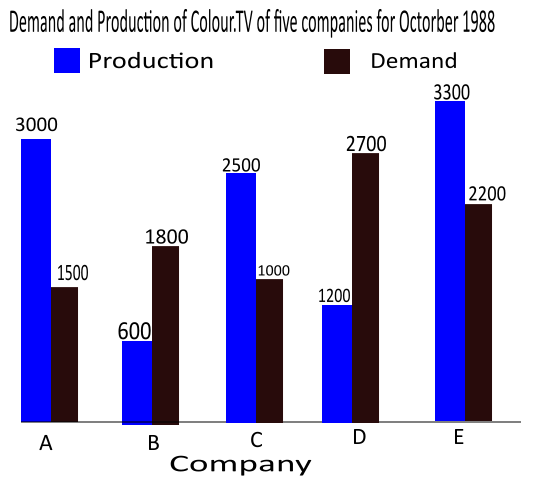
Q:Direction: Study the following graph carefully and answer the following questions.

The production of company D is approximately how many time that of the production of company A?
1109 060069b787a0c6e1017e04b44
60069b787a0c6e1017e04b44
- 11.5false
- 21.11false
- 31.8true
- 42.5false
- Show AnswerHide Answer
- Workspace
- SingleChoice

