Data Interpretation Questions Practice Question and Answer
8 Q:Directions: The bar graph given below shows the production (in ' 000 tones) of rice of a country for the year 2007 to 2011. Study the graph carefully and answer the question given below it.
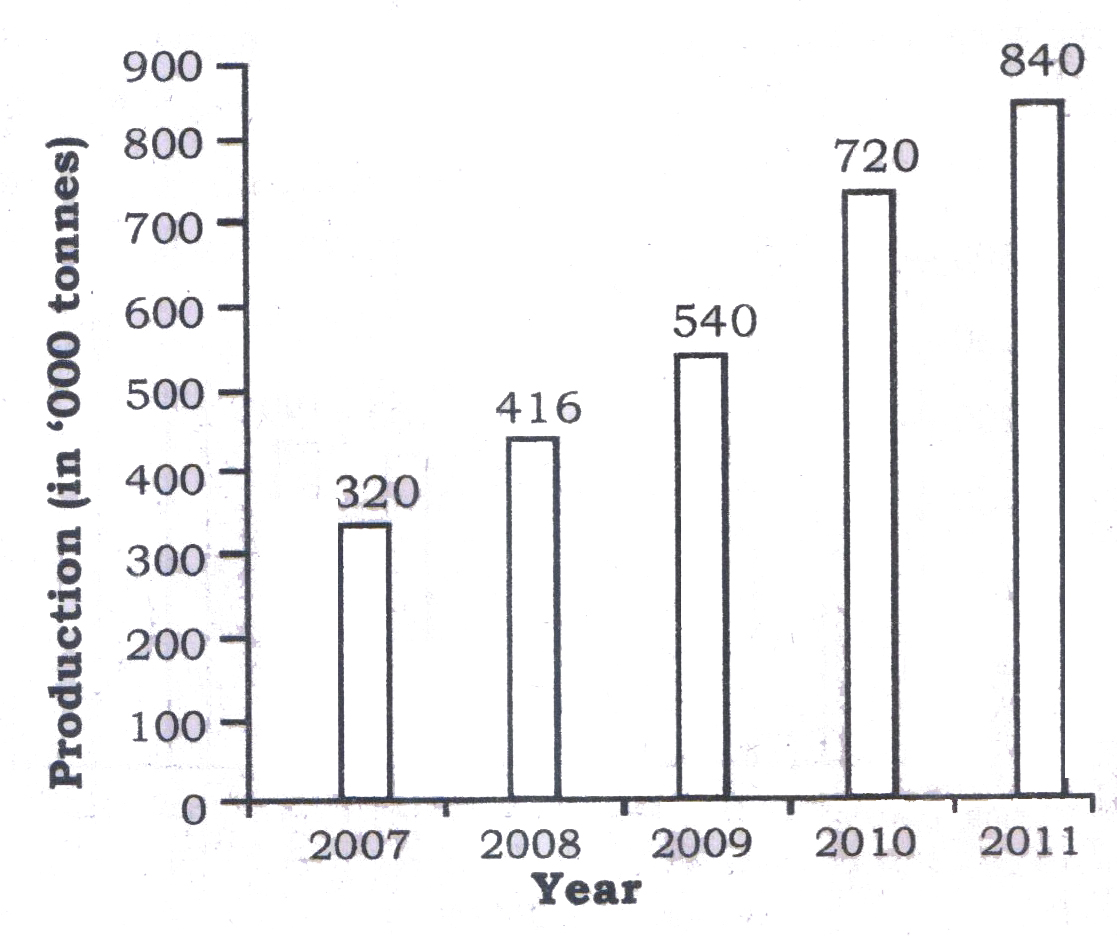
What is the percentage increase in the production of rice in the year 2008 in comparison to the year 2007?
1394 05e8185db4e941d3661dcba05
5e8185db4e941d3661dcba05- 125false
- 230true
- 335false
- 440false
- Show AnswerHide Answer
- Workspace
- SingleChoice
Answer : 2. "30 "
Q:The following penalty diagram shows the 4 year exam results of the students of 10th standard. Study the diagram and answer the following questions.
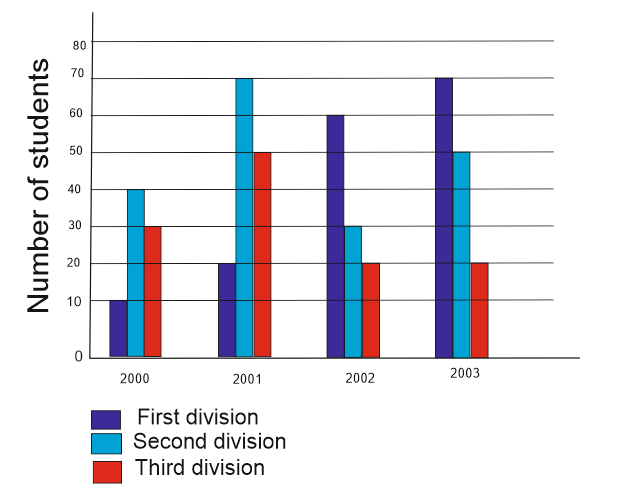
Name the number of students who appeared in the 10th standard examination in the year 2002-
1393 05dd4de3cc2282c484e48c334
5dd4de3cc2282c484e48c334- 1110true
- 290false
- 380false
- 4120false
- Show AnswerHide Answer
- Workspace
- SingleChoice
Answer : 1. "110"
Q:The line graph shows the number of vacancies of accountants in a certain company. Study the diagram and answer the following questions.
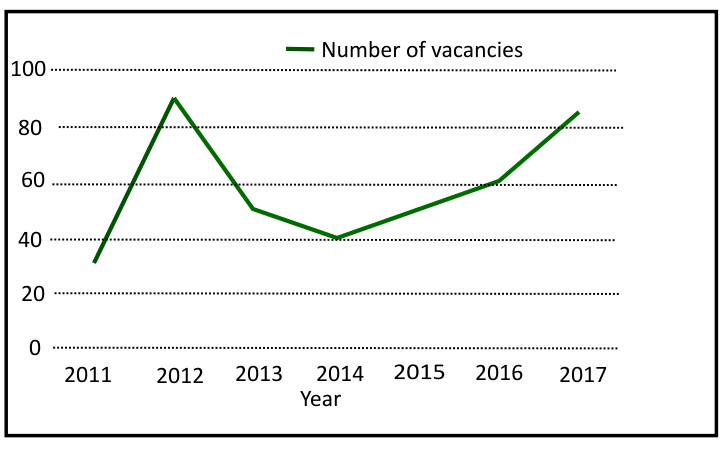
What is the average of the total vacancies?
1391 05f5b0f7769ed13038c1a9a5f
5f5b0f7769ed13038c1a9a5f- 158.58false
- 258.57true
- 360false
- 455false
- Show AnswerHide Answer
- Workspace
- SingleChoice
Answer : 2. "58.57"
Q:A motorist and a scooterist made a journey of 120 km at the same time and from the same place. The graph shows the progress of the journey made by each person. Study the graph and answer the questions.
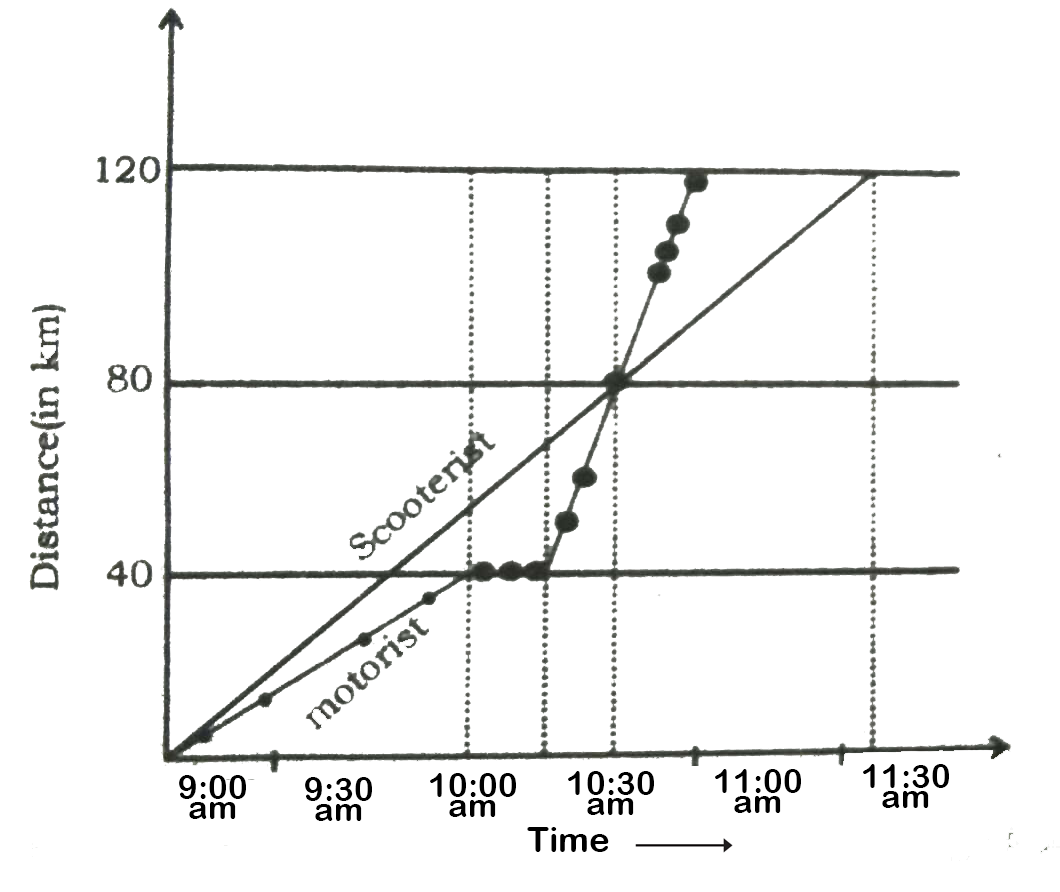
The scooterist completes the journey (in hours):
1390 05dd67d90a1c5834595c50f4f
5dd67d90a1c5834595c50f4f- 13false
- 22false
- 3$$2 {1\over 2} $$true
- 4$$3 {1\over 2} $$false
- Show AnswerHide Answer
- Workspace
- SingleChoice
Answer : 3. "$$2 {1\over 2} $$"
Q:Directions: Read the given pie and table carefully and answer the following questions.
The pie chart shows the percentage distribution of people who found COVID – 19 positive in four major cities of India from 1st July to 31st August 2020 and the table shows the number of people who tested positive in July from these cities.
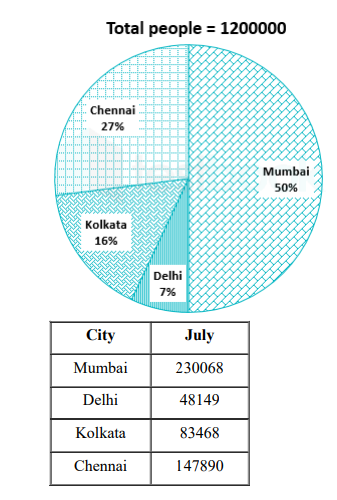
Total numbers of cases in July are how much more or less than the total number of cases in August of all four cities?
1387 064f5673a2bbb242750e8a25c
64f5673a2bbb242750e8a25c- 1509575false
- 2690425false
- 3180850true
- 4245689false
- 5None of thesefalse
- Show AnswerHide Answer
- Workspace
- SingleChoice
Answer : 3. "180850"
Q:Directions :- Refer the graph and answer the given questions.
The following line graph shows the number of products sold by company A and B during six years.
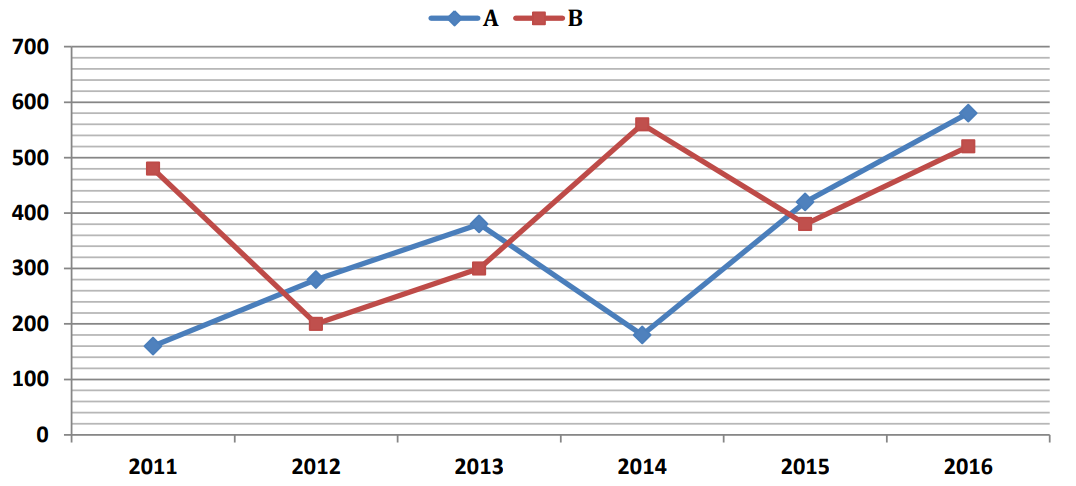
The number of products sold by B increased by what percent from 2011 and 2014 ?
1387 05fd32f2bd82ef86315b71216
5fd32f2bd82ef86315b71216The following line graph shows the number of products sold by company A and B during six years.
- 1$$ {14{2\over3}\%}$$false
- 2$$ {16{2\over3}\%}$$true
- 3$$ {24{2\over3}\%}$$false
- 4$$ {18{2\over3}\%}$$false
- 5$$ {25{1\over3}\%}$$false
- Show AnswerHide Answer
- Workspace
- SingleChoice
Answer : 2. "$$ {16{2\over3}\%}$$"
Q:Directions: The following graph gives Sales, Expense and Capital of a company for a period of five years 1994 to 1998. Read the graph and answer the following questions.
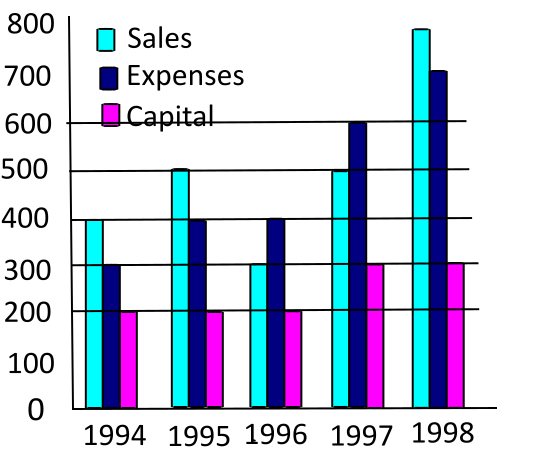
What was the average per annum increase in sales (in Rs. Cr.) from 1994 to 1998?
1386 05f40e3984c9a9415f7ce2acd
5f40e3984c9a9415f7ce2acd- 150false
- 260false
- 380true
- 4100false
- Show AnswerHide Answer
- Workspace
- SingleChoice
Answer : 3. "80"
Q:Directions: Study the following pie chart carefully and answer the questions given beside.
The following pie chart gives the information about breakup of six different categories of workers in a company.
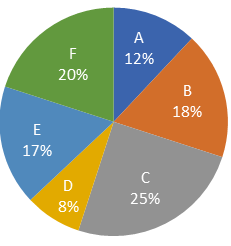
If total 1800 workers are working in the company then find the absolute difference between the number of workers in category D and category C?
1383 0601a56da8f9c7c5b6d8f3b8b
601a56da8f9c7c5b6d8f3b8bThe following pie chart gives the information about breakup of six different categories of workers in a company.
- 1323false
- 2306true
- 3289false
- 4286false
- Show AnswerHide Answer
- Workspace
- SingleChoice