Data Interpretation Questions Practice Question and Answer
8 Q:The following table shows the number of units of product produced and sold by a company over the course of six years.
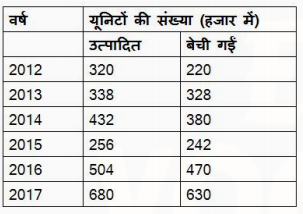
Find the ratio between the total number of units sold in 2013 and 2015 and the number of units produced in 2015 and 2016?
1383 0602e0668a503a25a4b89f1ae
602e0668a503a25a4b89f1ae- 114 : 19false
- 229 : 38false
- 33 : 4true
- 47 : 9false
- Show AnswerHide Answer
- Workspace
- SingleChoice
Answer : 3. "3 : 4"
Q: The following bar graph shows the number of students who like four different colours.
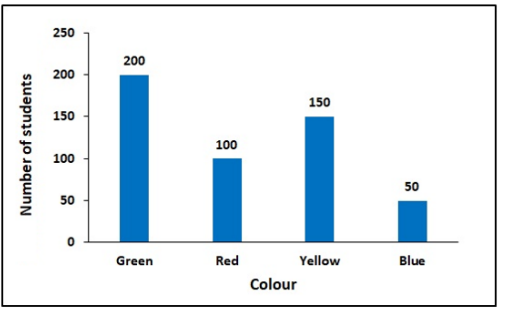
Find the difference between the number of students who like yellow and those who liked blue. 1383 0642812ae32185cce37155b84
642812ae32185cce37155b84- 1100true
- 2125false
- 350false
- 460false
- Show AnswerHide Answer
- Workspace
- SingleChoice
Answer : 1. "100"
Q:Direction: Study the pie chart carefully and answer the given questions. The pie chart shows the percentage breakup of students in different classes from VI to X in the year 2017
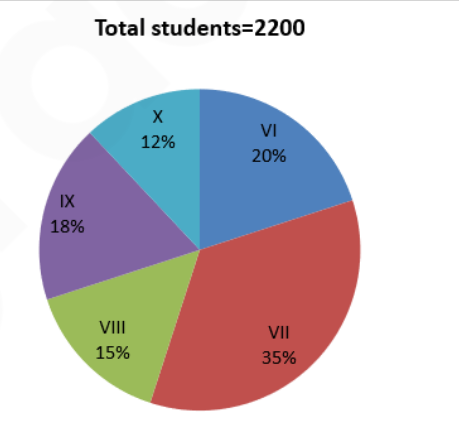
If the total number of boys in class VIII is “x” and the total number of boys in class IX is “x+40”. The total number of girls in class VIII and class IX together is 306. Then find the value of “x”.
1382 060a25856de4c2e1331dbead3
60a25856de4c2e1331dbead3- 1184false
- 2196false
- 3190true
- 4210false
- 5174false
- Show AnswerHide Answer
- Workspace
- SingleChoice
Answer : 3. "190"
Q:Directions: The bar graph given below shows the production (in ' 000 tones) of rice of a country for the year 2007 to 2011. Study the graph carefully and answer the question given below it.
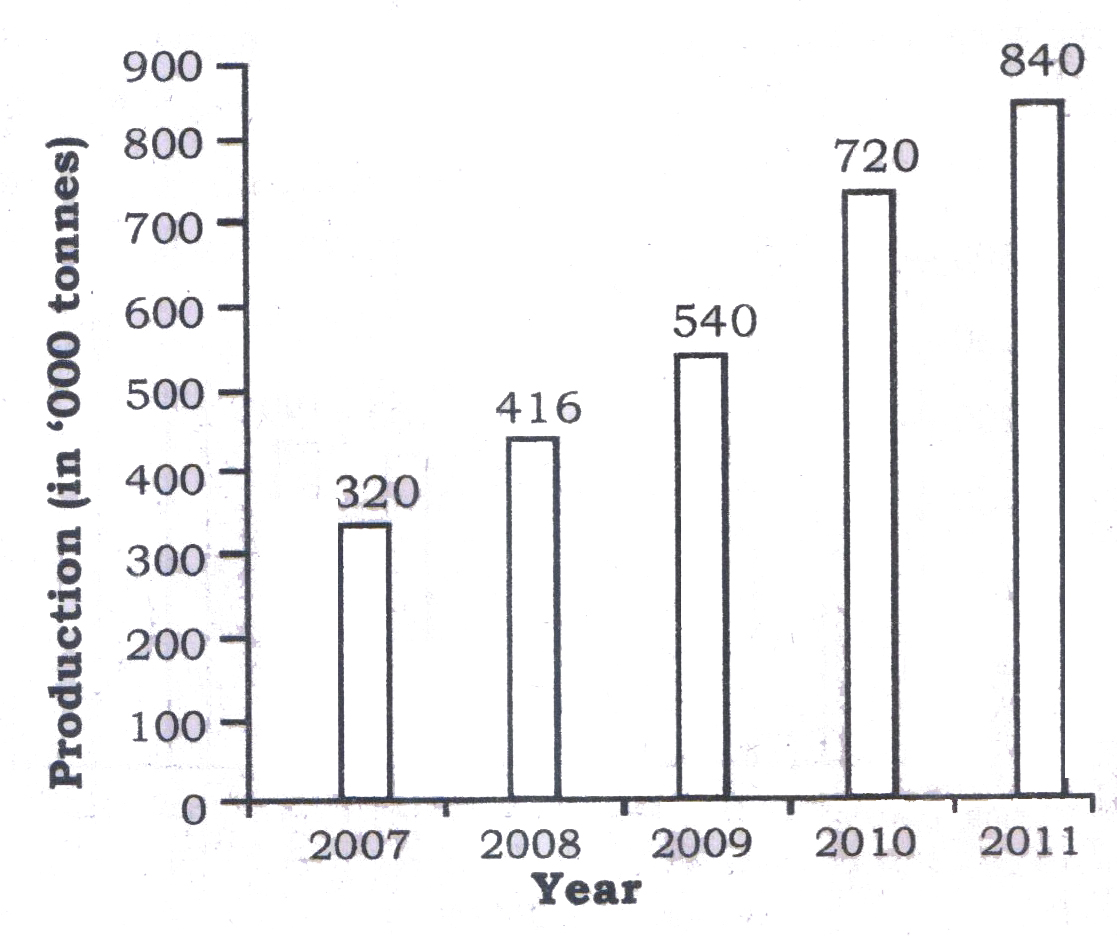
The production of rice in the year 2011 is what percent of the production of rice in 2010?
1382 05e81873d4e941d3661dcbfc5
5e81873d4e941d3661dcbfc5- 1116.66true
- 2121.5false
- 3133.33false
- 4108.5false
- Show AnswerHide Answer
- Workspace
- SingleChoice
Answer : 1. "116.66 "
Q:The following penalty diagram shows the 4 year exam results of the students of 10th standard. Study the diagram and answer the following questions.
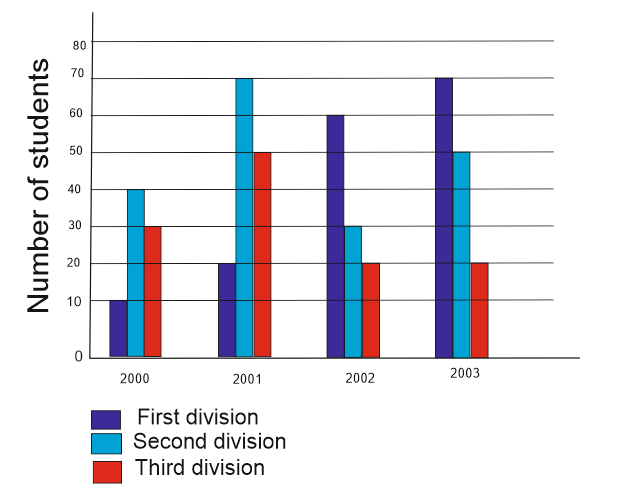
State the percentage increase in the first division in the year 2003 as compared to the year 2002:
1378 05dd4deaca1c5834595c1342a
5dd4deaca1c5834595c1342a- 116%false
- 2$$ 16{2\over3}%$$true
- 345%false
- 455%false
- Show AnswerHide Answer
- Workspace
- SingleChoice
Answer : 2. "$$ 16{2\over3}%$$"
Q:Directions: Study the following table carefully to answer the questions that follow Number of Gold coins (in hundred) produced in Five Different companies during Six Different month.
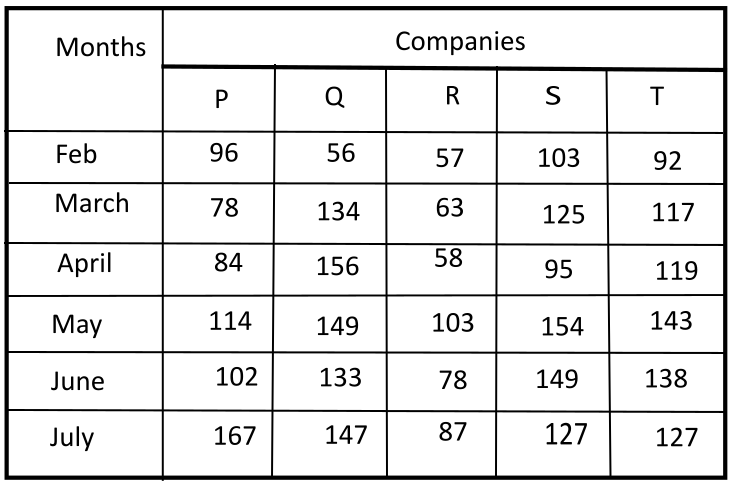
What was the respective ratio between the number of Gold coins produced from company P in the month may and the number of Gold coins produced from company T in the month June?
1377 05fd9c743bc259a5735cb4d76
5fd9c743bc259a5735cb4d76- 138 : 41false
- 223 : 21true
- 319 : 21false
- 419 : 23false
- 5None of thesefalse
- Show AnswerHide Answer
- Workspace
- SingleChoice
Answer : 2. "23 : 21 "
Q: The following pie chart shows the sectors representing the shares of the number of electric buses manufactured in each of 7 different colours in a given year in terms of the central angles (in degrees) with respect to the total number of buses manufactured during that year of all the 7 colours taken together.
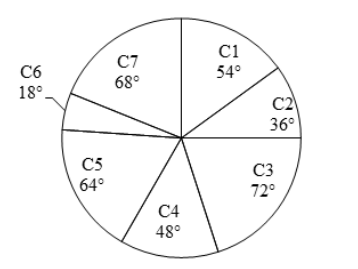
What is the difference in the percentage shares of buses of C4 and C6? [Give your answer correct to 2 decimal places.]
1370 06426e077ed76c064b85c7dd0
6426e077ed76c064b85c7dd0- 111.11%false
- 28.33 %true
- 39.09 %false
- 412.5 %false
- Show AnswerHide Answer
- Workspace
- SingleChoice
Answer : 2. "8.33 %"
Q:The line graph shows the number of vacancies of accountants in a certain company. Study the diagram and answer the following questions.
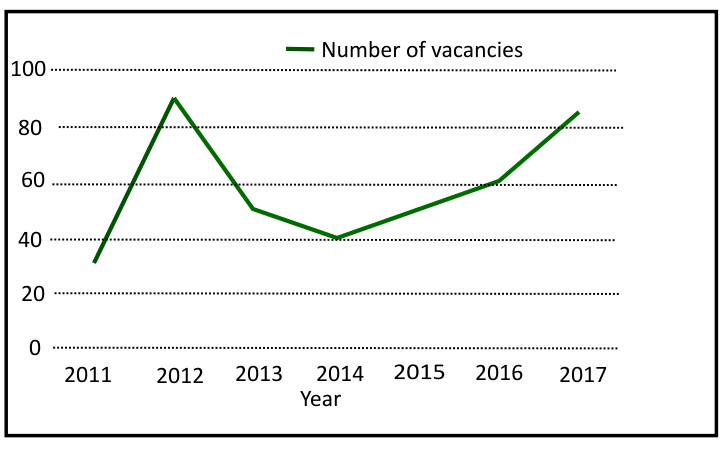
By what percent does the vacancies got increased in year 2016 from 2011?
1370 05f5b068a69ed13038c1a5fef
5f5b068a69ed13038c1a5fef- 180%false
- 2100%true
- 360%false
- 440%false
- Show AnswerHide Answer
- Workspace
- SingleChoice