Data Interpretation Questions Practice Question and Answer
8 Q:Direction: The given Bar Graph Presents the number of different types of vehicles (in lakhs) exported by a company during 2014 and 2015.
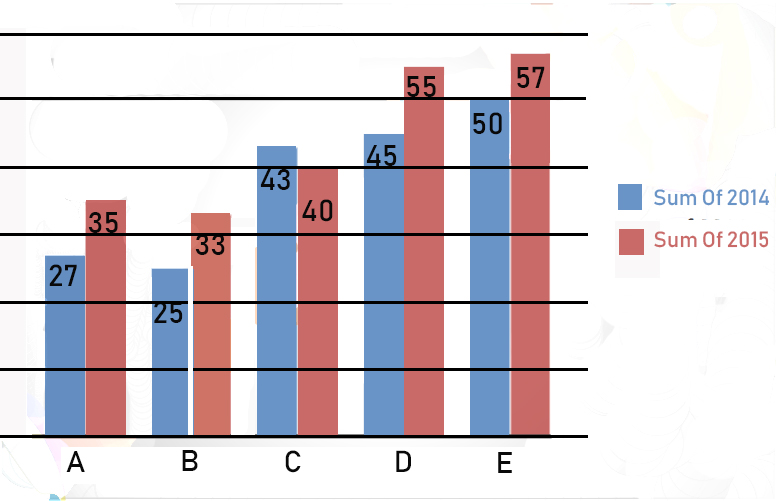
The total number of type B, D and E vehicles exported in 2014 is what percentage of the total number of type A, C, D and E vehicles exported in 2015 (correct to one decimal place)?
1353 060251238083f2c6596c27f10
60251238083f2c6596c27f10- 163.8%false
- 264.2%true
- 362.4%false
- 461.6%false
- Show AnswerHide Answer
- Workspace
- SingleChoice
Answer : 2. "64.2% "
Q:Directions: The following bar graph shows the percentage breakup of a Sunil’s salary from year 2012 to 2016. With the given information, find the following questions.
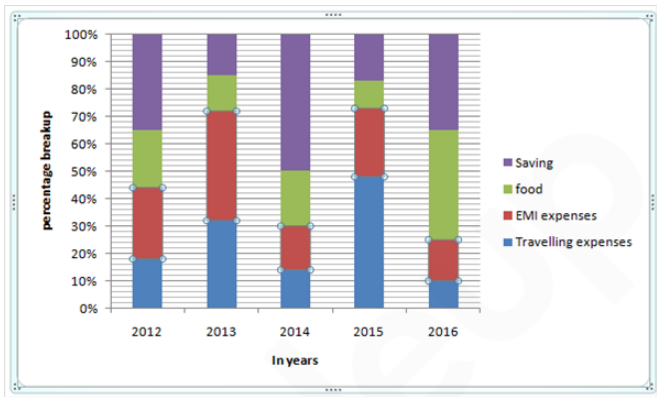
If the ratio on saving in the year 2013 and 2016 are in the ratio 3 : 5. Then what is the ratio of EMI expenses in the year 2013 and 2016.
1353 060a239cab1d2440614b9885b
60a239cab1d2440614b9885b- 18:15false
- 256:15true
- 356:5false
- 4Can’t be determinedfalse
- 5None of thesefalse
- Show AnswerHide Answer
- Workspace
- SingleChoice
Answer : 2. "56:15 "
Q:Directions: The following graph gives Sales, Expense and Capital of a company for a period of five years 1994 to 1998. Read the graph and answer the following questions.
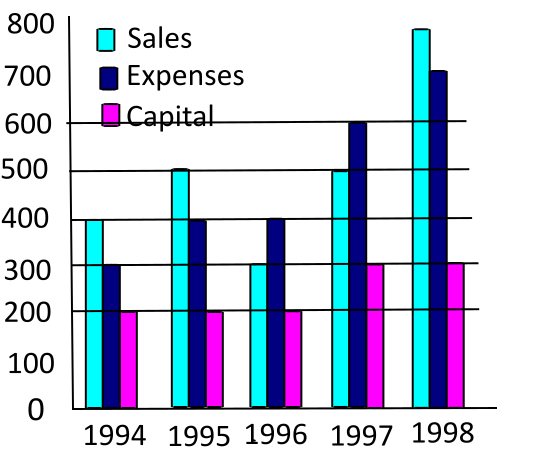
In which year was the ratio of profits to capital the highest?
1353 05f40e5d69b782961da3f9518
5f40e5d69b782961da3f9518- 11998false
- 21995true
- 31996false
- 41997false
- Show AnswerHide Answer
- Workspace
- SingleChoice
Answer : 2. "1995"
Q:Directions: The bar graph given below shows the production (in ' 000 tones) of rice of a country for the year 2007 to 2011. Study the graph carefully and answer the question given below it.
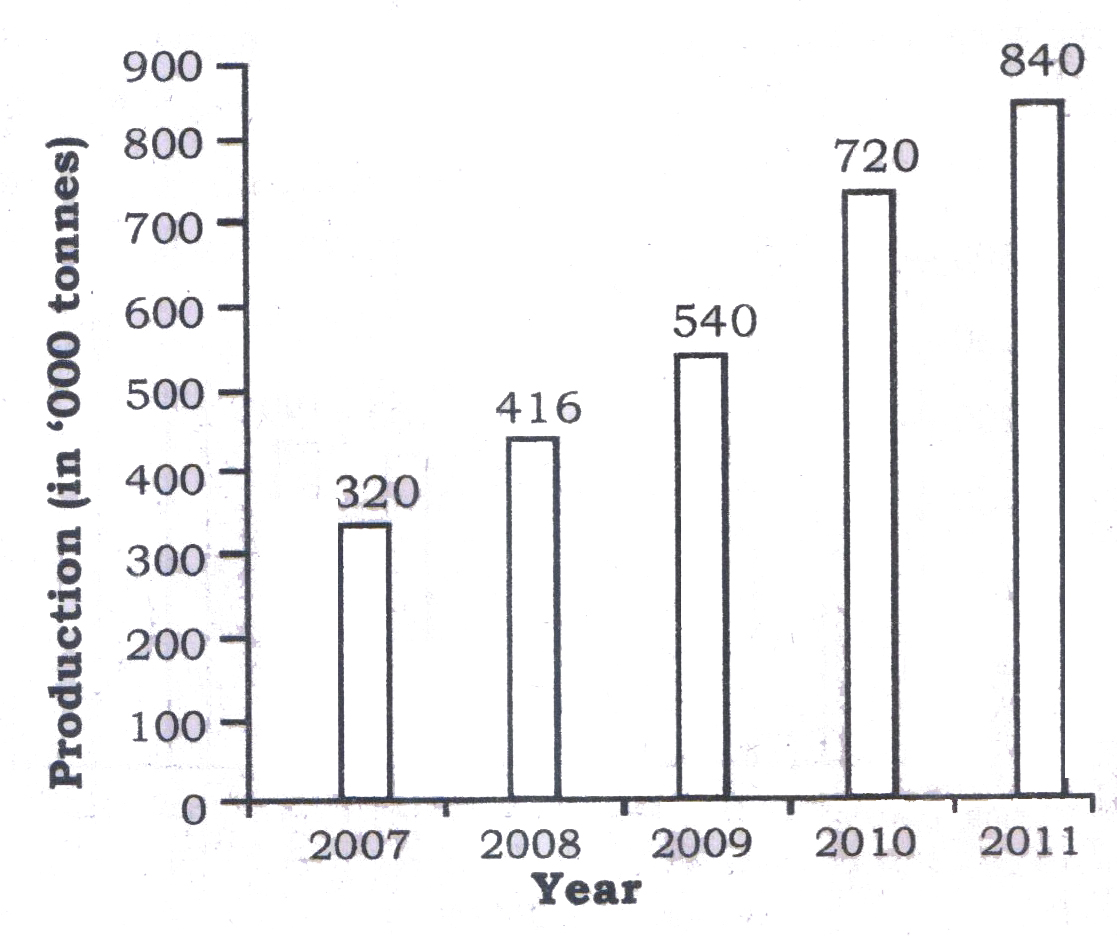
What is the average production of rice per year from 2009 to 2011? (in thousand tones)
1352 05e81867ad56d695255db5622
5e81867ad56d695255db5622- 1700true
- 2550false
- 3860false
- 4900false
- Show AnswerHide Answer
- Workspace
- SingleChoice
Answer : 1. "700 "
Q:The table given below shows the information about bats manufactured by 6 different companies. Each company manufactures only plastic and wooden bats. Each company labels these bats as Brand A or Brand B. The table shows the number of plastic bats as a percentage of total bats manufactured by each company. It also shows the ratio of wooden bats labelled A and B. Each company manufactured a total 550000 bats.

P=sum of wooden bats of Brand B manufactured by S and wooden bats of Brand A manufactured by W.
Q= Difference of Brand B wooden bats and Brand A wooden bats manufactured by U.
What is the value of P - Q ?
1349 05f30d80ebcbb69394d1c9f66
5f30d80ebcbb69394d1c9f66Q= Difference of Brand B wooden bats and Brand A wooden bats manufactured by U.
What is the value of P - Q ?
- 167,500false
- 217,7700false
- 315,9500true
- 412,3500false
- Show AnswerHide Answer
- Workspace
- SingleChoice
Answer : 3. "15,9500"
Q: The bar graph shows the number of passports issued in a country in 6 consecutive years.
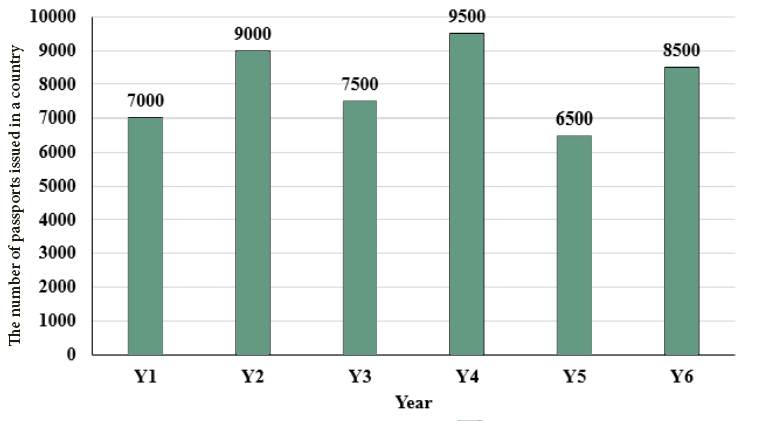
What is the average number of passports issued per year?
1347 06450cd6139143d085f370f7d
6450cd6139143d085f370f7d- 111200false
- 27600false
- 38000true
- 412000false
- Show AnswerHide Answer
- Workspace
- SingleChoice
Answer : 3. "8000 "
Q:Directions: Read the given pie and table carefully and answer the following questions.
The pie chart shows the percentage distribution of people who found COVID – 19 positive in four major cities of India from 1st July to 31st August 2020 and the table shows the number of people who tested positive in July from these cities.
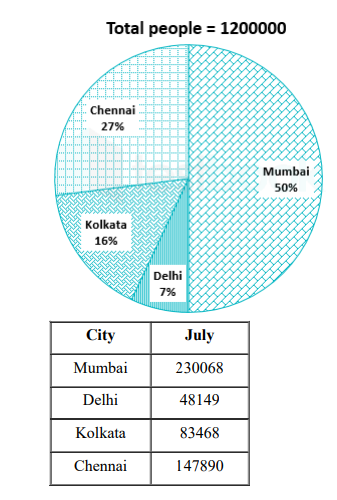
What is the average of the number of people in August from Mumbai and the number of people in July from Chennai who tested positive?
1346 064f566a7a1e68c7201ab110d
64f566a7a1e68c7201ab110d- 1258911true
- 2324526false
- 3242478false
- 4278562false
- 5None of thesefalse
- Show AnswerHide Answer
- Workspace
- SingleChoice
Answer : 1. "258911"
Q:Direction : The table given below represents number of bikes of five different brands sold from 2001- 2005, with the help of data given in the table, answer the following questions.
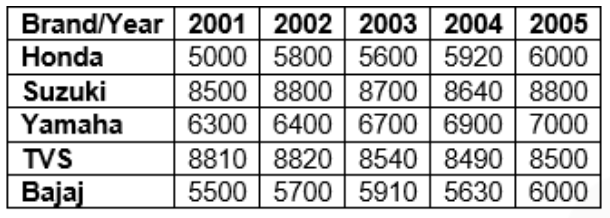
In how many years the increase of selling is greater than 10% for any brand?
1346 060a4ee64b1d2440614c02ef0
60a4ee64b1d2440614c02ef0- 11true
- 22false
- 33false
- 44false
- 5None of thesefalse
- Show AnswerHide Answer
- Workspace
- SingleChoice