Data Interpretation Questions Practice Question and Answer
8 Q:Direction : The table given below represents number of bikes of five different brands sold from 2001- 2005, with the help of data given in the table, answer the following questions.
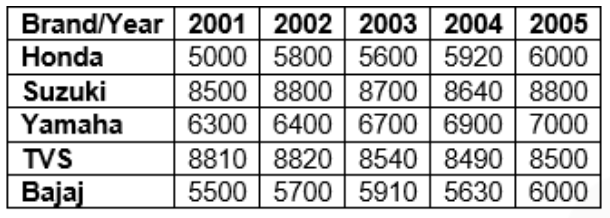
In how many years the increase of selling is greater than 10% for any brand?
1346 060a4ee64b1d2440614c02ef0
60a4ee64b1d2440614c02ef0- 11true
- 22false
- 33false
- 44false
- 5None of thesefalse
- Show AnswerHide Answer
- Workspace
- SingleChoice
Answer : 1. "1 "
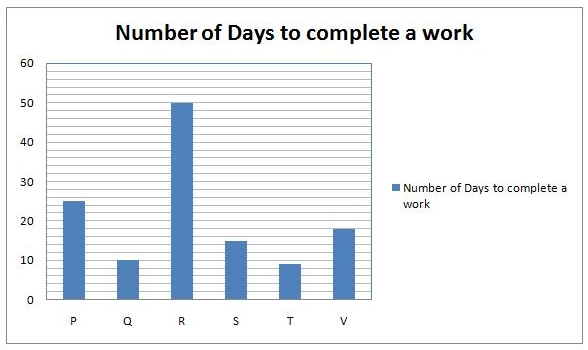
Q:Study the following graph carefully to answer the given questions
M can do a piece of work 5 days less than that of P. M and P began to work together but M leaves after some days and P completed the remaining work in 12 days. Number of days after which M left the job-
1344 05ea943003dbbdc76195ae70c
5ea943003dbbdc76195ae70c- 1$$ 5{7\over9}$$true
- 2$$ 6{7\over9}$$false
- 3$$ 7{7\over9}$$false
- 4$$ 11{7\over9}$$false
- 5None of thesefalse
- Show AnswerHide Answer
- Workspace
- SingleChoice
Answer : 1. "$$ 5{7\over9}$$"
Q:Pie chart shows the percent of money spent by family on various item during 1999. Study the graph and answer these questions.
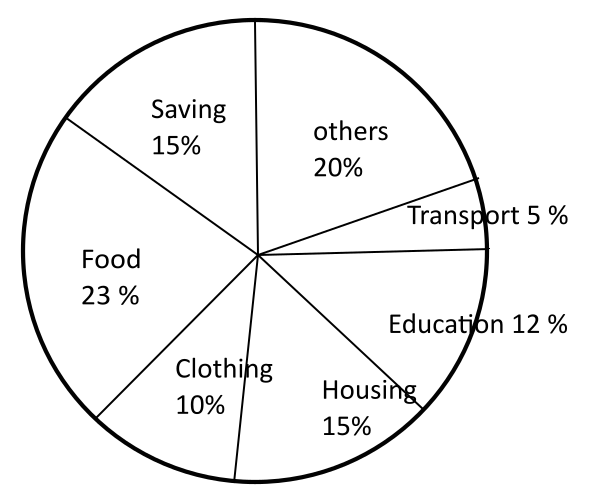
If the total amount spent was Rs. 46,000, how much money was spent on clothing and housing together?
1343 05fb4e4ff488efb77b438030b
5fb4e4ff488efb77b438030b- 1Rs. 1150false
- 2Rs. 11500true
- 3Rs. 10000false
- 4Rs. 15000false
- Show AnswerHide Answer
- Workspace
- SingleChoice
Answer : 2. "Rs. 11500"
Q:Directions: The bar graph given below shows the production (in ' 000 tones) of rice of a country for the year 2007 to 2011. Study the graph carefully and answer the question given below it.
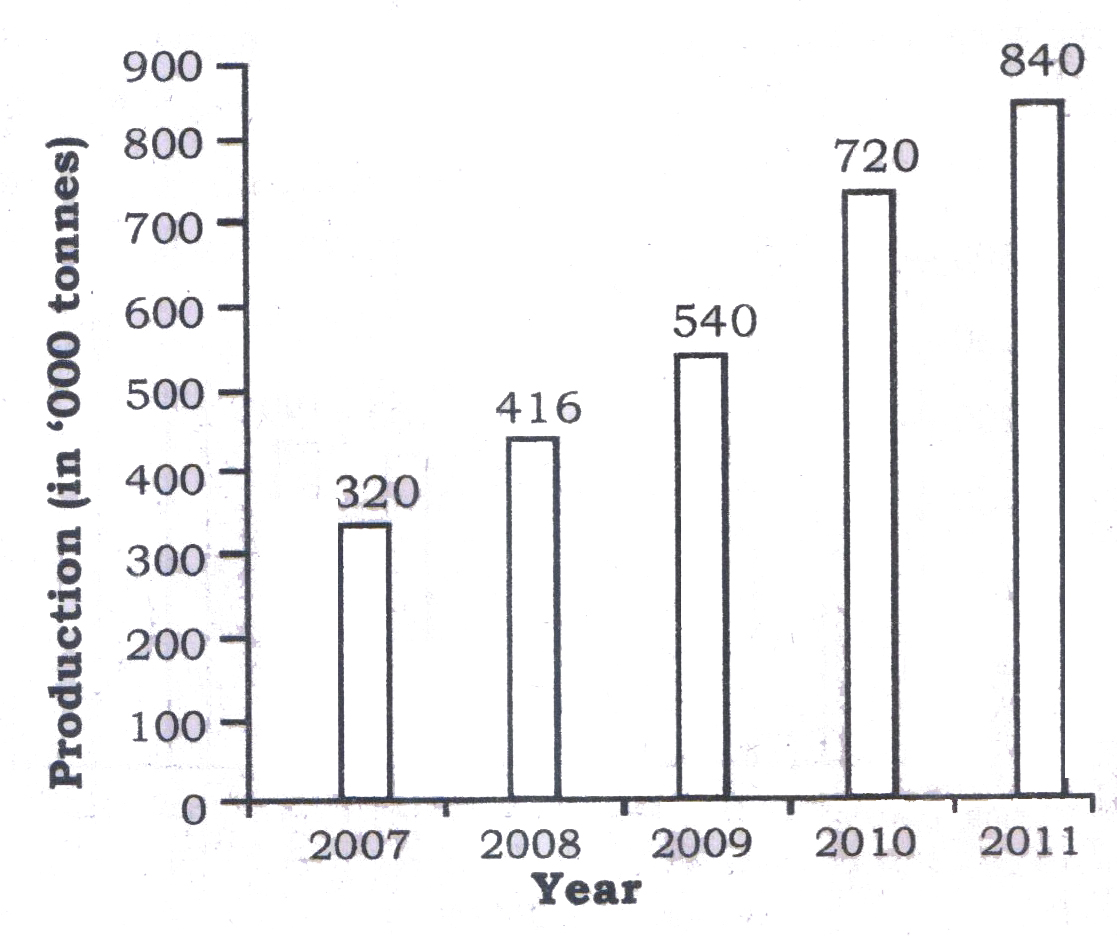
The production of rice in the year 2010 is how much percent more than the production of rice in the year 2009?
1341 05e8186dcd56d695255db5657
5e8186dcd56d695255db5657- 121.5false
- 237.5false
- 342.5false
- 433.33true
- Show AnswerHide Answer
- Workspace
- SingleChoice
Answer : 4. "33.33 "
Q:Directions: Study the following table carefully to answer the questions that follow .
Number of soldiers ( in thousands ) joining five different forces during six different.
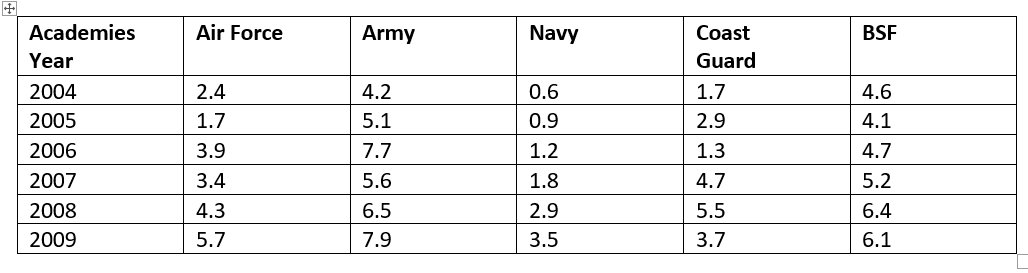
What was the average number of soldiers joining all the forces together in the year 2007?
1339 05e82ebabd06376635697510a
5e82ebabd06376635697510aNumber of soldiers ( in thousands ) joining five different forces during six different.
- 14,620false
- 242,400false
- 34,260false
- 442,600false
- 5None of thesetrue
- Show AnswerHide Answer
- Workspace
- SingleChoice
Answer : 5. "None of these "
Q:Study the following graph carefully to answer the given questions
R started the work and left after some days, when 25% work was done. After it Z joined and completed it working for 25 days. In how many days R and Z can do the complete work, working together?
1338 05ea940b83dbbdc76195addaf
5ea940b83dbbdc76195addaf- 16false
- 28false
- 310false
- 412false
- 520true
- Show AnswerHide Answer
- Workspace
- SingleChoice
Answer : 5. "20"
Q:Study the given pie chart and answer the question that follows.
Distribution (Degree wise) of students studying in schools A, B, C, D and E
Total Number of students =9000
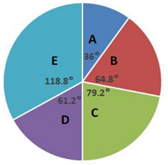
The number of students in School E exceeds the total number of students in school A and B by x, where x lies between:
1336 060532b11a01bc44789ae80ef
60532b11a01bc44789ae80efDistribution (Degree wise) of students studying in schools A, B, C, D and E
Total Number of students =9000
- 1440 and 460true
- 2420 and 440false
- 3460 and 480false
- 4400 and 420false
- Show AnswerHide Answer
- Workspace
- SingleChoice
Answer : 1. "440 and 460"
Q: The following pie chart shows the percentage-wise distribution of the nominal sales figures of laptops of five different companies during a given period.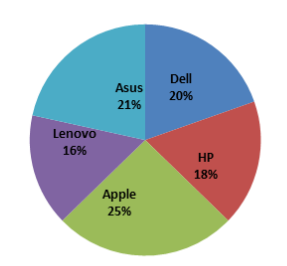
If the total sales of all the companies taken together is ₹55,00,000, then find the difference between the sales of HP and Apple.
1334 0643d1aba2d621da11696d46d
643d1aba2d621da11696d46d- 1₹ 3,65,000false
- 2₹ 7,50,000false
- 3₹ 4,25,000false
- 4₹ 3,85,000true
- Show AnswerHide Answer
- Workspace
- SingleChoice