Data Interpretation Questions Practice Question and Answer
8 Q:Directions: Study the graph carefully and answer the following questions.
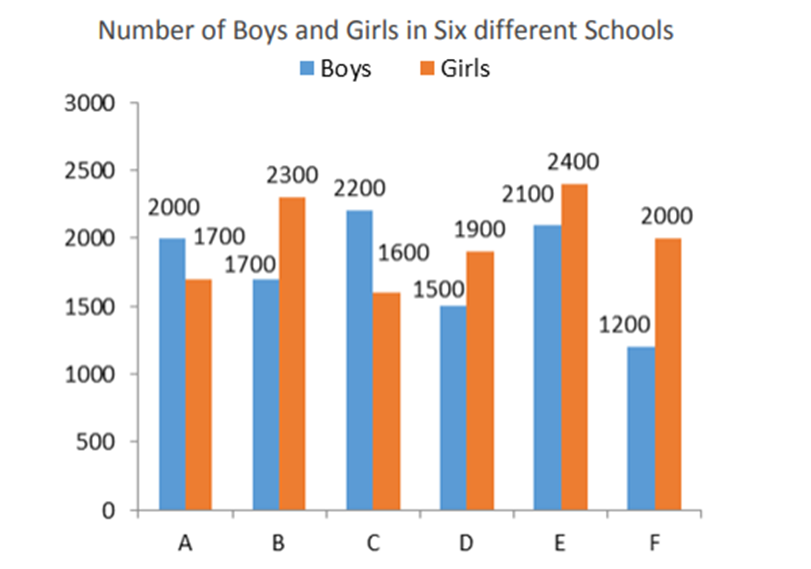
Find the respective ratio of the number of students in school D and school F.
1310 062c3fa9495b7933e5332909f
62c3fa9495b7933e5332909f- 115 : 14false
- 214 : 15false
- 317 : 16true
- 416 : 17false
- 5None of thesefalse
- Show AnswerHide Answer
- Workspace
- SingleChoice
Answer : 3. "17 : 16 "
Q:Directions: The line graph shows the number of work visas issued by a country in each year from 2011 to 2016. Study the diagram and answer the following questions .
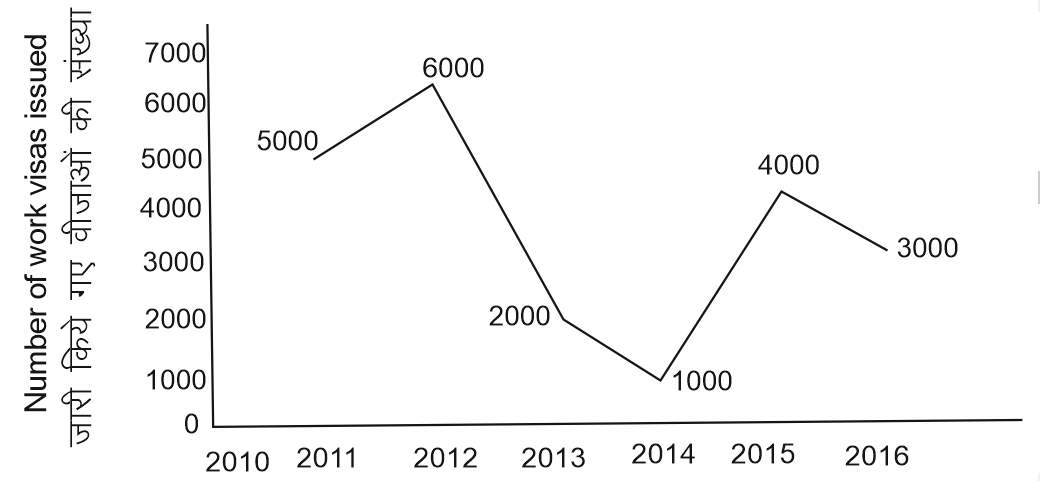
Number of work visas issued were more than those issued in the previous years in how many years ?
1310 05ed9f058e11a1c4b43e6e702
5ed9f058e11a1c4b43e6e702- 11false
- 23false
- 34false
- 42true
- Show AnswerHide Answer
- Workspace
- SingleChoice
Answer : 4. "2 "
Q:Table below shows the number of candidates appearing for the interview and the percentage of candidates found eligible for the post in various companies (A, B, C, D, E, F).
Study the Tables and give answer the following Questions.
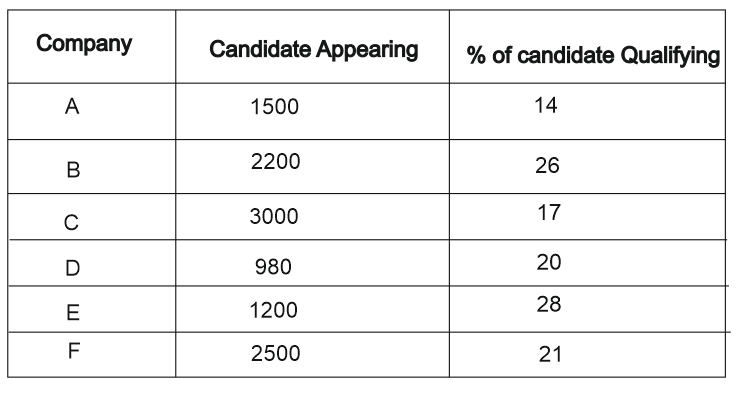
What is the respective ratio between the number of qualified candidates in Company A and the number of candidates qualified in Company E?
1305 05f1e725ca844e17b150ccfc7
5f1e725ca844e17b150ccfc7Study the Tables and give answer the following Questions.
- 12:5false
- 23:7false
- 35:8true
- 45:6false
- Show AnswerHide Answer
- Workspace
- SingleChoice
Answer : 3. "5:8"
Q:The table given below shows the information about bats manufactured by 6 different companies. Each company manufactures only plastic and wooden bats. Each company labels these bats as Brand A or Brand B. The table shows the number of plastic bats as a percentage of total bats manufactured by each company. It also shows the ratio of wooden bats labelled A and B. Each company manufactured a total 550000 bats.

Taking all 6 companies together, how many wooden bats of Brand A have been produced?
1304 05f30d866bcbb69394d1ca3a7
5f30d866bcbb69394d1ca3a7- 1691000true
- 2724000false
- 3683000false
- 4716000false
- Show AnswerHide Answer
- Workspace
- SingleChoice
Answer : 1. "691000"
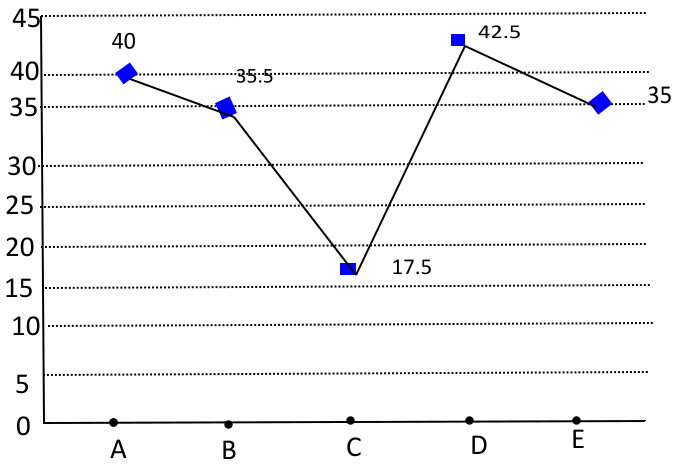
Q:Study the graph carefully and answer the following questions.
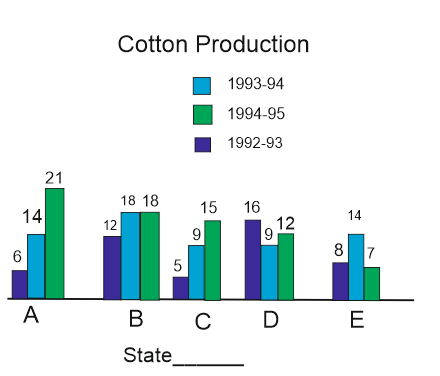
What is the average production of the five states in the year 1994-95 taken together?
1303 05f1565b7eddbc50839d53581
5f1565b7eddbc50839d53581- 112.3false
- 214.6true
- 315.6false
- 416.3false
- Show AnswerHide Answer
- Workspace
- SingleChoice
Answer : 2. "14.6"
Q:Directions: Read the below data carefully and answer the following questions.
The table shows the total number of ice cream (Chocobar + Cornetto) was given by Santa Claus on the day of Xmas to 5 children. It also shows the number of Chocobar ice-creams is how much more or less percentage of the total number of Cornetto ice-creams.
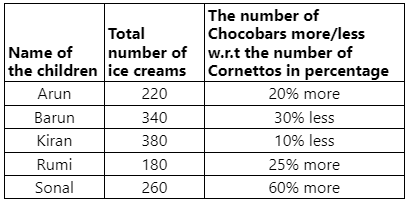
Find the ratio between the total number of Chocobars Arun, Kiran and Rumi have and the total number of Cornetto Barun and Sonal have.
1300 064dccaec462ecdc3adb582fb
64dccaec462ecdc3adb582fbThe table shows the total number of ice cream (Chocobar + Cornetto) was given by Santa Claus on the day of Xmas to 5 children. It also shows the number of Chocobar ice-creams is how much more or less percentage of the total number of Cornetto ice-creams.
- 11 ∶ 2false
- 22 ∶ 3false
- 33 ∶ 4false
- 44 ∶ 3true
- 5None of thesefalse
- Show AnswerHide Answer
- Workspace
- SingleChoice
Answer : 4. "4 ∶ 3"
Q:Read the following graph carefully and answer the related questions-
Total number of students (in thousands) participating in comitative exam in various cities.
What is the ratio of number of students appearing tor competitive exam from city B to number of students appearing for competitive exam from city A?
1296 0602377822dc71d4148a571bd
602377822dc71d4148a571bd- 13:4false
- 213:16false
- 311:16false
- 4None of thesetrue
- Show AnswerHide Answer
- Workspace
- SingleChoice
Answer : 4. "None of these "
Q:Directions: The Pie chart given here represents the domestic expenditure of a family in per cent. Study the chart and answer the following questions if the total monthly income of the family is ₹ 33,650.
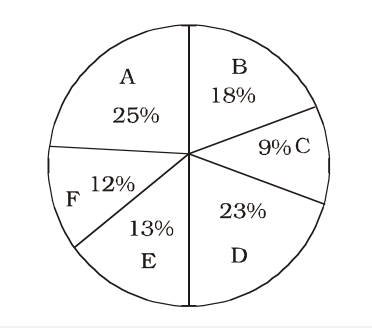
A: Expenditure on food
B: Expenditure on house-rent
C: Expenditure on entertainment
D: Expenditure on education and maintenance of children
E: Medical and miscellaneous expenditure
F: Deductions towards provident fund
The annual savings in the form of provident fund would be
1296 0638f310334f83f147297f6fb
638f310334f83f147297f6fb- 1₹ 48,456true
- 2₹ 48,540false
- 3₹ 44,856false
- 4₹ 45,480false
- Show AnswerHide Answer
- Workspace
- SingleChoice