Data Interpretation Questions Practice Question and Answer
8 Q:The line graph shows the number of vacancies of accountants in a certain company. Study the diagram and answer the following questions.
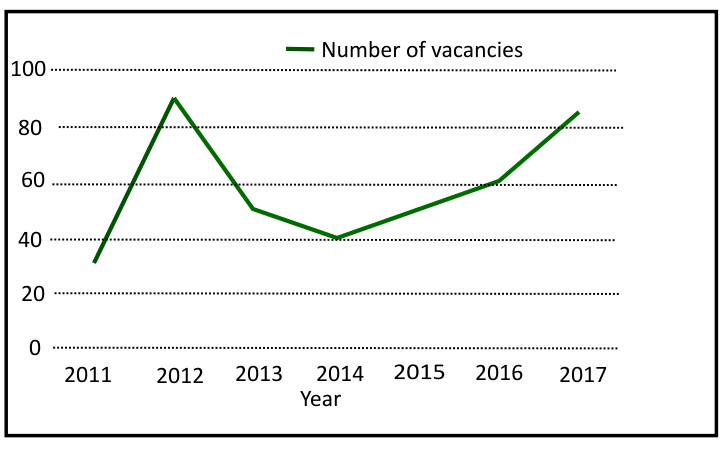
In which year maximum vacancies produced?
1278 05f5b0d2869ed13038c1a8a01
5f5b0d2869ed13038c1a8a01- 12012, 2017true
- 22014, 2016false
- 32013, 2016false
- 4None of thesefalse
- Show AnswerHide Answer
- Workspace
- SingleChoice
Answer : 1. "2012, 2017"
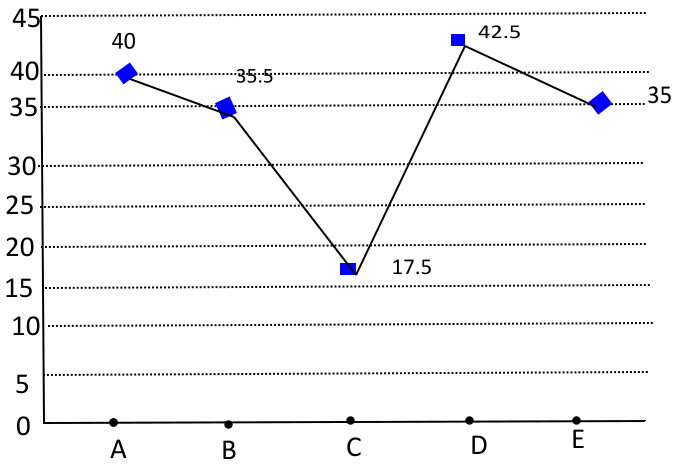
Q:Direction: Study the following graph carefully and answer the following questions.
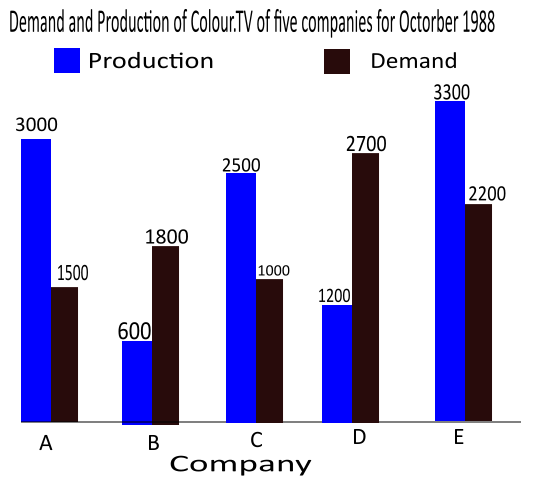
The production of company D is approximately how many time that of the production of company A?
1276 060069b787a0c6e1017e04b44
60069b787a0c6e1017e04b44- 11.5false
- 21.11false
- 31.8true
- 42.5false
- Show AnswerHide Answer
- Workspace
- SingleChoice
Answer : 3. "1.8"
Q:Study the given pie chart and answer the question that follows.
Distribution (Degree wise) of students studying in schools A, B, C, D and E
Total Number of students =9000
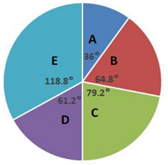
If the ratio of the number of boys to that of girls in school C is 6 : 5 and that in school B is 7 : 11,then what is the ratio of the number of boys in school C to the number of girls in school B?
1276 060532a75528a962d2e430021
60532a75528a962d2e430021Distribution (Degree wise) of students studying in schools A, B, C, D and E
Total Number of students =9000
- 110 : 11false
- 211 : 10false
- 312 : 11true
- 411: 12false
- Show AnswerHide Answer
- Workspace
- SingleChoice
Answer : 3. "12 : 11"
Q:Direction: The given Bar Graph Presents the number of different types of vehicles (in lakhs) exported by a company during 2014 and 2015.
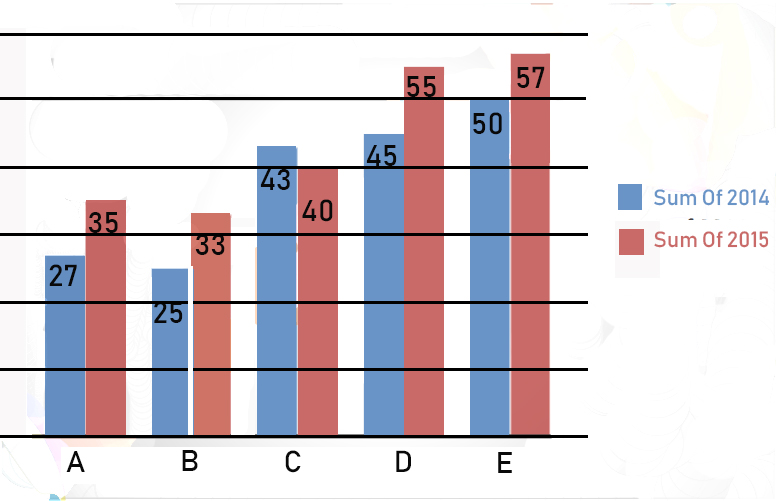
Which type of vehicle showed a 32% increase in export in 2015 as compared to that in the previous year?
1275 060251372cce66f776c87be6b
60251372cce66f776c87be6b- 1Btrue
- 2Afalse
- 3Efalse
- 4Dfalse
- Show AnswerHide Answer
- Workspace
- SingleChoice
Answer : 1. "B"
Q:Study the given graph and answer the question that follows.
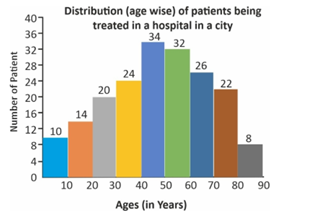
The number of patients aged 10 or more years but below 40 years is what per cent less than the number of patients aged 50 or more years but below 80 years?
1274 060a2176bf98a597725140356
60a2176bf98a597725140356- 130.2false
- 225false
- 334false
- 427.5true
- Show AnswerHide Answer
- Workspace
- SingleChoice
Answer : 4. "27.5"
Q:Directions: Study the following information carefully and answer the questions given below.
In the table, the percentage of shirts (formal and casual) sold out of the total number of shirts sold in the week and the number of casual shirts sold data related to the number of shirts sold on ve weekdays – Monday, Tuesday, Wednesday, Thursday and Friday are given.
Total number of shirts sold in the week = x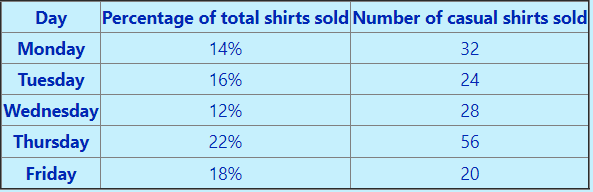 Note: Total number of shirts sold on Saturday and Sunday together = 72
What is the average number of total shirts sold on Wednesday, Friday, Saturday and Sunday together?
1274 064e5ed45de1aa1b70fd9c28f
64e5ed45de1aa1b70fd9c28fIn the table, the percentage of shirts (formal and casual) sold out of the total number of shirts sold in the week and the number of casual shirts sold data related to the number of shirts sold on ve weekdays – Monday, Tuesday, Wednesday, Thursday and Friday are given.
Note: Total number of shirts sold on Saturday and Sunday together = 72- 164false
- 224false
- 336false
- 448true
- 5None of thesefalse
- Show AnswerHide Answer
- Workspace
- SingleChoice
Answer : 4. "48"
Q:Direction : The table given below represents number of bikes of five different brands sold from 2001- 2005, with the help of data given in the table, answer the following questions.
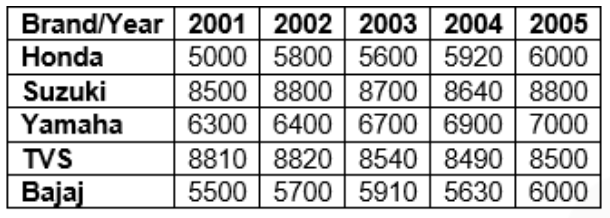
If sales of Suzuki in the year 2006 is increased by 5% and sales of Yamaha decreased by 5%, then what is the difference of averages of sales of Suzuki in year 2001 and 2006 and average sales of Yamaha in 2002 and 2006?
1272 060a4f033f98a5977251a2404
60a4f033f98a5977251a2404- 11170false
- 22000false
- 32330false
- 42345true
- 5None of thesefalse
- Show AnswerHide Answer
- Workspace
- SingleChoice
Answer : 4. "2345"
Q:Read the following graph carefully and answer the related questions-
Total number of students (in thousands) participating in comitative exam in various cities.
What is the percentage of students appearing in competitive exam from city E to total number of students appearing for competitive exam from all the states?
1271 060237c5aad295556282de836
60237c5aad295556282de836- 115false
- 217false
- 319false
- 421true
- Show AnswerHide Answer
- Workspace
- SingleChoice