Data Interpretation Questions Practice Question and Answer
8 Q:The following table shows the number of units of product produced and sold by a company during six years.
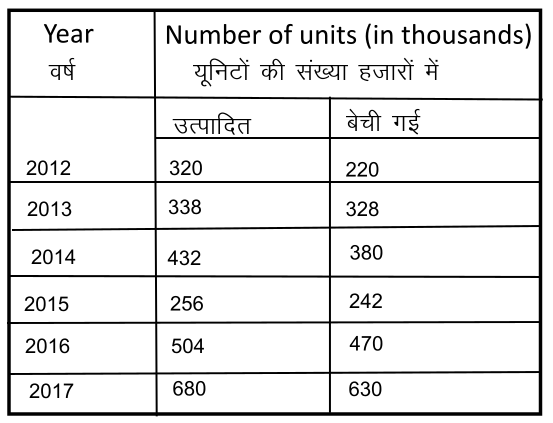
What is the percentage of the number of units produced in 2017 more than the number of units produced since 2012?
1263 05f6d9b315256e8407c2dd4ea
5f6d9b315256e8407c2dd4ea- 1114 %false
- 2112.5 %true
- 3114.25%false
- 4113 %false
- Show AnswerHide Answer
- Workspace
- SingleChoice
Answer : 2. "112.5 %"
Q:Direction: Study the following table carefully and answer the given questions. Table shows the of passed students in four schools and ratio between passed boys and girls among them. The ratio between failed boys and girls is reverse of passed ratio between them.
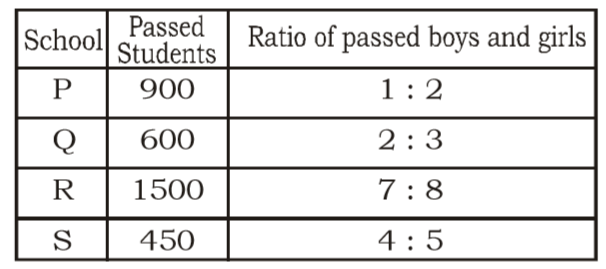
Find the approx average number of passed students in all the schools together.
1261 05e9d34e0bf0a265d837bd778
5e9d34e0bf0a265d837bd778- 1873false
- 2843false
- 3833false
- 4863true
- 5853false
- Show AnswerHide Answer
- Workspace
- SingleChoice
Answer : 4. "863 "
Q:Directions : A bar graph showing the heights of six mountain peaks is given below. Study the bar graph and answer the questions.

What is the respective ratio of the heights of the highest peak and the lowest peak?
1261 063930cba9dda13791d7446a2
63930cba9dda13791d7446a2- 122 : 15true
- 215 : 22false
- 320 : 13false
- 413 : 22false
- Show AnswerHide Answer
- Workspace
- SingleChoice
Answer : 1. "22 : 15 "
Q:Study the following graph carefully to answer the given questions
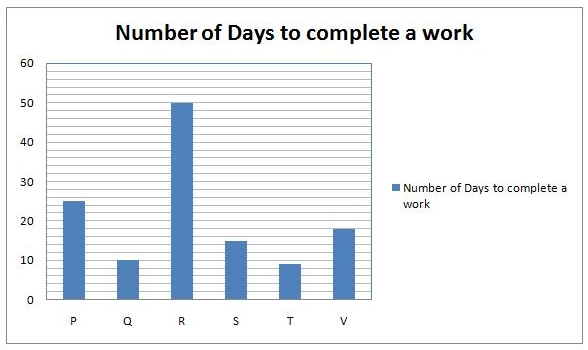
After working for 3 days S is joined by O. If they complete the remaining work in 3 more days, in how many days can O alone complete the work?
1260 05ea9428a3dbbdc76195ae47f
5ea9428a3dbbdc76195ae47f- 110 daysfalse
- 28 daysfalse
- 35 daystrue
- 412 daysfalse
- 515 daysfalse
- Show AnswerHide Answer
- Workspace
- SingleChoice
Answer : 3. "5 days"
Q:Study the graphs to answer these questions.
The pie chart shows the percentage of graduate employees in various department of M/S XYZ limited.
The employees in various departments of M/S. XYZ limited. Other than graduate employees are those employees who are either post graduate or undergraduates.

The number of graduate employees in Administration and Production together is how many times other than graduate employees in Marketing and Finance together?
1255 060114302af82aa3010a2ea48
60114302af82aa3010a2ea48The pie chart shows the percentage of graduate employees in various department of M/S XYZ limited.
The employees in various departments of M/S. XYZ limited. Other than graduate employees are those employees who are either post graduate or undergraduates.
- 13.5false
- 20.285true
- 30.445false
- 40.215false
- Show AnswerHide Answer
- Workspace
- SingleChoice
Answer : 2. "0.285 "
Q:Directions: Read the given pie and table carefully and answer the following questions.
The pie chart shows the percentage distribution of people who found COVID – 19 positive in four major cities of India from 1st July to 31st August 2020 and the table shows the number of people who tested positive in July from these cities.
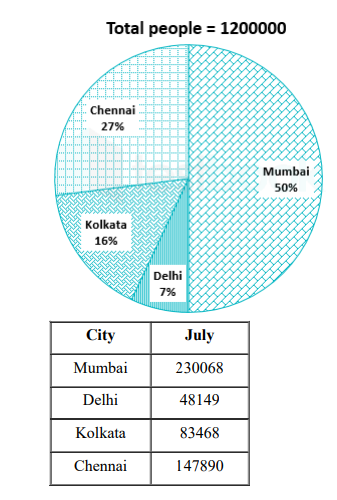
Number of people from Delhi who tested positive in July is what percent of total positive tested people of that city?
1255 064f5664c90902899fbf4708e
64f5664c90902899fbf4708e- 156%false
- 257.32%true
- 362.58%false
- 460%false
- 559.86%false
- Show AnswerHide Answer
- Workspace
- SingleChoice
Answer : 2. "57.32%"
Q:Directions: Read the given pie and table carefully and answer the following questions.
The pie chart shows the percentage distribution of people who found COVID – 19 positive in four major cities of India from 1st July to 31st August 2020 and the table shows the number of people who tested positive in July from these cities.
Total peoples tested positive in Delhi is what percent of the total number of people tested positive in Mumbai?
1253 064f567912bbb242750e8a3fd
64f567912bbb242750e8a3fd- 111%false
- 214%true
- 316%false
- 418%false
- 519%false
- Show AnswerHide Answer
- Workspace
- SingleChoice
Answer : 2. "14%"
Q:Direction : The table given below represents number of bikes of five different brands sold from 2001- 2005, with the help of data given in the table, answer the following questions.
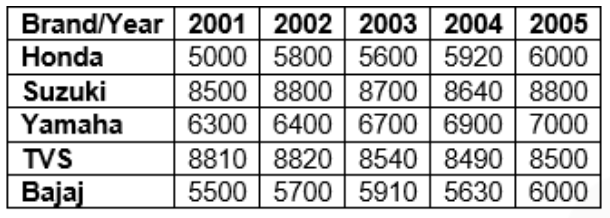
The sales of Yamaha increased from 2001 to 2005 by what percentage?
1252 060a4eed6b33a50608a41f7f0
60a4eed6b33a50608a41f7f0- 113.33%false
- 210.6%false
- 311.11%true
- 412%false
- 5None of thesefalse
- Show AnswerHide Answer
- Workspace
- SingleChoice