Data Interpretation Questions Practice Question and Answer
8 Q:Directions: The following Pie Chart shows the export of different food grains from India in 2010. Study the chart and answer the questions:
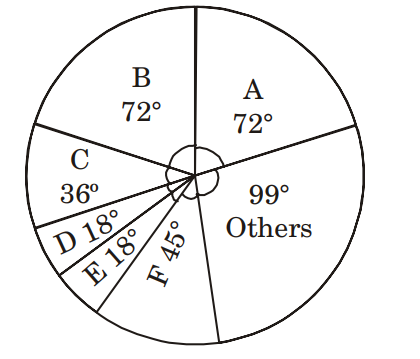
Of the total export of foodgrains, the percentage of crop B exported is
1221 063be693d8f5b1f774c4c4c20
63be693d8f5b1f774c4c4c20- 115%false
- 220%true
- 318%false
- 410%false
- Show AnswerHide Answer
- Workspace
- SingleChoice
Answer : 2. "20%"
Q:Directions : In an Institution there are 800 students. Students use different modes of transport for going to the institution and return. The given pie diagram represents the requisite data. Study the diagram carefully and answer the questions.

The number of students who do not use institute bus is
1221 063ac3322e541fa7a013045e0
63ac3322e541fa7a013045e0- 1330false
- 2350false
- 3480false
- 4320true
- Show AnswerHide Answer
- Workspace
- SingleChoice
Answer : 4. "320 "
Q:Direction: The following table shows the number of students of 7 colleges A, B, C, D, E, F, G participating in extra-curricular activities :
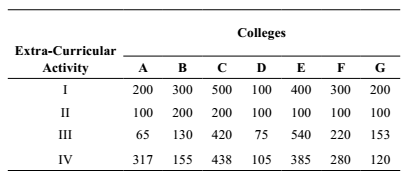
The college in which minimum number of students participate in extracurricular activities is ?
1214 06011472caf82aa3010a2f6a7
6011472caf82aa3010a2f6a7- 1Dtrue
- 2Gfalse
- 3Ffalse
- 4Afalse
- Show AnswerHide Answer
- Workspace
- SingleChoice
Answer : 1. "D "
Q:Directions: The table given here shows the production of five types of cars by a company in the year 1989 to 1994. Study the table and answer questions.
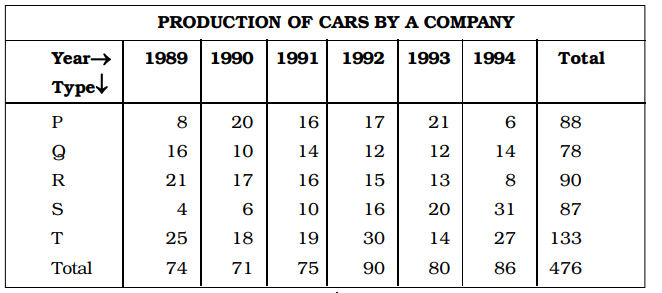
In which year the production of
cars of all types taken together
was approximately equal to the
average of the total production
during the period?
1209 0632daf605c208a6bf7f2631a
632daf605c208a6bf7f2631a- 11989false
- 21991false
- 31993true
- 41994false
- Show AnswerHide Answer
- Workspace
- SingleChoice
Answer : 3. "1993 "
Q: The following bar chart shows the exports (in ₹'0000) of an item from a country 5 consecutive years.
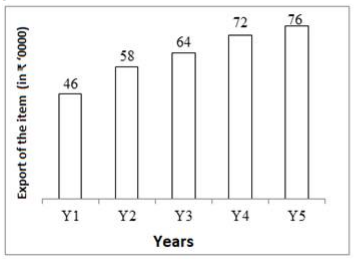
What is the average value of the export of that item from the given country per year?
1208 06422531432185cce370793c0
6422531432185cce370793c0- 1₹5,96,000false
- 2₹6,32,000true
- 3₹6,24,000false
- 4₹6,48,000false
- Show AnswerHide Answer
- Workspace
- SingleChoice
Answer : 2. "₹6,32,000"
Q:Study the given graph and answer the question that follows.
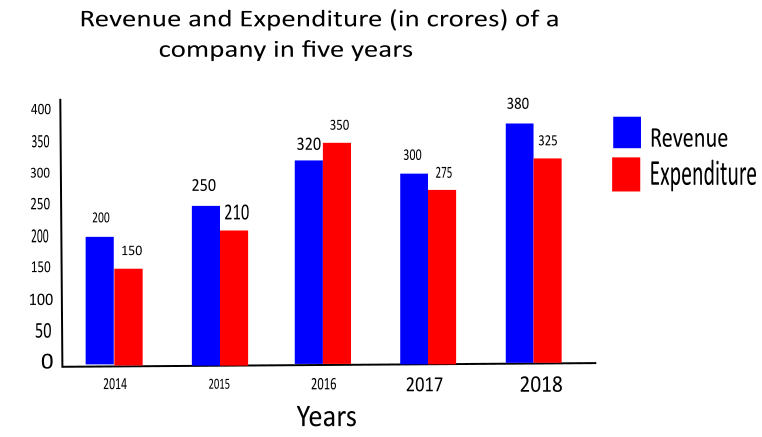
In how many years was the revenue of the company more than 1.2 times the average expenditure over the given five years?
1208 05fbf76cf2e911753dd59d872
5fbf76cf2e911753dd59d872- 14false
- 22true
- 31false
- 43false
- Show AnswerHide Answer
- Workspace
- SingleChoice
Answer : 2. "2"
Q:Directions : The graph shows the demand and production of different companies. Study the graph and answer the following questions.
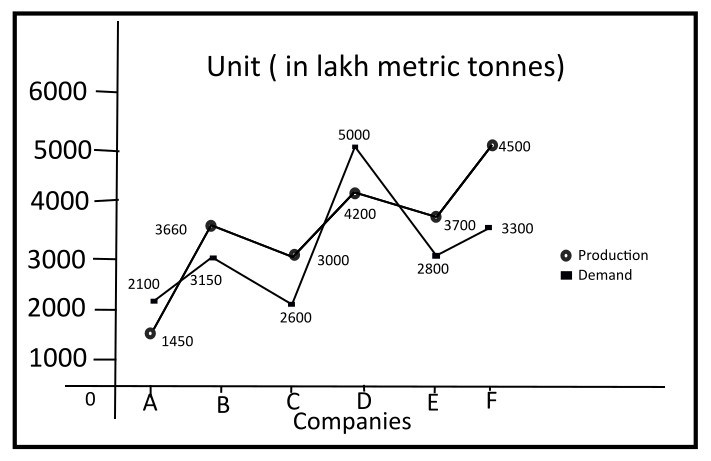
The production of company A is approximately what percent of the demand of company C?
1207 05f4f72990c72eb234933723c
5f4f72990c72eb234933723c- 150%false
- 260%false
- 355 %true
- 465%false
- Show AnswerHide Answer
- Workspace
- SingleChoice
Answer : 3. "55 %"
Q:Direction : The table given below represents number of bikes of five different brands sold from 2001- 2005, with the help of data given in the table, answer the following questions.
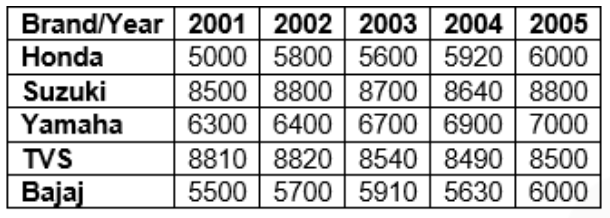
What is the ratio of average sales of TVS in year 2002 and 2005 to the average sales of Honda in year 2001 and 2004?
1201 060a4ef9163194a66f2d07028
60a4ef9163194a66f2d07028- 1273:433false
- 2433: 273true
- 3111:142false
- 4441:173false
- 5None of thesefalse
- Show AnswerHide Answer
- Workspace
- SingleChoice